Interquartile - Study guides, Class notes & Summaries
Looking for the best study guides, study notes and summaries about Interquartile? On this page you'll find 625 study documents about Interquartile.
Page 3 out of 625 results
Sort by
-
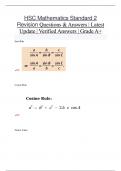
HSC Mathematics Standard 2 Revision Questions & Answers | Latest Update | Verified Answers | Grade A+
- Exam (elaborations) • 14 pages • 2024
- Available in package deal
-
- $11.49
- + learn more
Sine Rule :: Cosine Rule :: Future Value :: the amount of money in the future that an amount of money today will yield, given prevailing interest rates Trapezoidal rule :: Limit of reading :: smallest unit on the measuring instrument also known as precision. Absolute error :: ½ × limit of reading (maximum value) Interquartile Range (IQR) :: the difference between the first quartile and third quartile. Q3 - Q1 standard deviation :: a measure of the spread of data about the m...
-
Straighterline Introduction to Statistics questions with complete solutions 2023
- Exam (elaborations) • 5 pages • 2023
-
Available in package deal
-
- $10.99
- 2x sold
- + learn more
Straighterline Introduction to Statistics questions with complete solutions 2023Four steps in the process of statistics 1. Producing Data 2. Exploratory Data Analysis 3. Probability 4. Inference Categorical variable places individuals into one of several groups Two types: nominal and ordinal Quantitative Variable represents a measurement or a count Two types: Interval and ratio Nominal Variable categorical variables where there is no natural order among the categori...
-
RESEARCH METHODS MIDTERM - MCPHS SPRING QUESTIONS & ANSWERS VERIFIED 100% CORRECT!!
- Exam (elaborations) • 8 pages • 2024
- Available in package deal
-
- $7.99
- + learn more
null hypothesis (H0) - the statistical hypothesis tested by the statistical procedure; usually a hypothesis of no difference or no relationship Interquartile Range (IQR) - the difference between the first and third quartiles (middle 50% of observations) dichotomous measure - describes the presence or absence of an attribute (ex smoker/nonsmoker) nominal data - categories that vary with no natural order (ex blood types) ordinal data - categories with natural order but without clear units (e...
-
NSG 522 Pre Midterm Questions and Answers 2024/2025
- Exam (elaborations) • 30 pages • 2024
-
- $13.09
- + learn more
Frequencies Just the count or number of observations in each category. Abbreviated as 'n' or 'f' Relative Frequency The number of times a particular observation occurs divided by the total number of observations. Frequency Distribution A summary of the numerical counts of the values or categories of a measurement. Cumulative Frequency The number of observations with a value less than the maximum value of the variable interval. Cumulative Relative Frequency...
-
D204 Preassessment Questions and Answers 100% Correct
- Exam (elaborations) • 18 pages • 2024
- Available in package deal
-
- $12.49
- + learn more
D204 Preassessment Questions and Answers 100% Correct Which activity does an analyst perform in the discovery phase of the data analytics life cycle? a. Collecting Data b. Cleaning Data c. Identifying outliers d. Identifying business needs - Answer- Identifying business needs In which phase of the data analytics life cycle does an analyst build a histogram? a. Data acquisition b. Data exploration c. Discovery d. Predictive modeling - Answer- Data Exploration An analyst applies a sta...
-
QMB 3200 Final Exam Bliss Questions and Answers 100% accurate!!!
- Exam (elaborations) • 27 pages • 2024
-
- $11.99
- + learn more
QMB 3200 Final Exam Bliss Q Excel's __________ can be used to construct a cross tabulation. Answers: a. COUNTIF function b. SUM function c. PivotTable Report d. Chart Tools - ANSWERSC. PivotTable Report To construct a pie chart using Excel's Chart Tools, choose __________ as the chart type. Answers: a. line b. column c. scatter d. pie - ANSWERSd. pie Excel's __________ function can be used to compute the sample covariance. Answers: a. COVARIANCE.S b. VAR c. CORRE...
-
green packet MC Correctly Answered Questions | UpToDate | Already Graded A+
- Exam (elaborations) • 39 pages • 2024
-
- $13.99
- + learn more
Of the following dotplots, which represents the set of data that has the greatest standard deviation? : B split in half A random sample of 374 United States pennies was collected, and the age of each penny was determined. According to the boxplot below, what is the approximate interquartile range (IQR) of the ages? graph A 8 B 10 C 16 2 | P a g e D 40 E 50 : C 16 graph The histogram above shows the number of minutes needed by 45 students to finish playing a computer ga...
-
C207 Already Passed Exam Questions and CORRECT Answers
- Exam (elaborations) • 16 pages • 2024
-
- $7.99
- + learn more
1. Which of the following statistics are unaffected by a single large outlier? (More than one) * Median, mode, Interquartile range (IQR) 2. Which of the following is most suitable for policy making based on income distribution? * Median Because of assumed skewed distribution 3. If we study data from a population whose mean is 200 and standard deviation is 30, which of the following data points has a z-score of -3? * 110. 4. Which of the following statistics measures the spread of the d...
-
NSG 522 Pre Midterm Questions And Answers 100% Guaranteed Success.
- Exam (elaborations) • 15 pages • 2024
-
- $12.99
- + learn more
NSG 522 Pre Midterm Questions And Answers 100% Guaranteed Success. Frequencies - correct answer.Just the count or number of observations in each category. Abbreviated as 'n' or 'f' Relative Frequency - correct answer.The number of times a particular observation occurs divided by the total number of observations. Frequency Distribution - correct answer.A summary of the numerical counts of the values or categories of a measurement. Cumulative Frequency - correct answer.Th...
-
QMB 3200 Actual Exam with Questions and Answers|100% Solution
- Exam (elaborations) • 10 pages • 2024
-
- $11.99
- + learn more
The standard deviation of a point estimator is the - standard error Cluster sampling is - a probability sampling method The interquartile range is the difference between the - first and third quartiles A __________ can be used to graphically present quantitative data. - both a histogram and a stem-and-leaf display are correct

Did you know that on average a seller on Stuvia earns $82 per month selling study resources? Hmm, hint, hint. Discover all about earning on Stuvia


