Unimodal - Study guides, Class notes & Summaries
Looking for the best study guides, study notes and summaries about Unimodal? On this page you'll find 183 study documents about Unimodal.
Page 4 out of 183 results
Sort by
-
Statistics final wgu academy exam questions and answers
- Exam (elaborations) • 7 pages • 2024
- Available in package deal
-
- $11.49
- + learn more
Statistics final wgu academy exam questions and answers Categorical variables that there is no natural order among the categories - Answer- nominal variables Categorical variables where there is natural order among the categories (low-high) - Answer- ordinal variable A measurement which makes sense to talk about the difference between values but not the ratio between values - Answer- interval Quantitive variables where is makes sense to talk about the difference in ratios. (Income, weig...
-
AP Statistics Chapter 2 Review Practice Questions 2024.
- Exam (elaborations) • 3 pages • 2024
-
Available in package deal
-
- $9.99
- + learn more
AP Statistics Chapter 2 Review Practice Questions 2024. Density Curve - correct answer A curve that is always above the horizontal axis and has an area underneath of exactly one Median of density curve - correct answer The "equal areas" part, the part with half the curve to it's left and right Quartiles - correct answer Area under the curve is divided into quarters Mean of density curve - correct answer The "balance" part When does the mean equal the median? - correct answer Wh...
-
Business Analytics Chapter 3 All Answers Correct
- Exam (elaborations) • 4 pages • 2024
-
Available in package deal
-
- $9.49
- + learn more
Business Analytics Chapter 3 All Answers Correct graph for a quantitative variable ️histogram since there are no categories in a histogram, we usually slice up all of the possible values into_____ and then count the number of cases that fall in each of these ️bins like histograms, but they also give individual values ️stem-and leaf displays what are the 2 steps in making a stem-and-leaf display? ️1. use the first digit of a number (called the stem) to name the bins. The stem ...
-
BESC 3010 Exam 1 Questions And Answers 100% Verified.
- Exam (elaborations) • 4 pages • 2024
-
- $11.99
- + learn more
BESC 3010 Exam 1 Questions And Answers 100% Verified. nominal level of measurement - correct cterized by data that consist of names, labels, or categories only, and the data cannot be arranged in an ordering scheme (such as low to high) ordinal level of measurement - correct answer.a measurement of a variable in which the numbers indicating a variable's values specify only the order of the cases, permitting greater than and less than distinctions interval level of measurement -...
-
PSYC 2005 Exam 1 Study Questions And Answers 100% Verified.
- Exam (elaborations) • 9 pages • 2024
-
Available in package deal
-
- $13.49
- + learn more
descriptive statistics - correct answer psychologists use this to summarize and describe a group fo numbers from a research study inferential statistics - correct answer we use this to draw conclusions and make inferences that are based on the numbers from a research study but go beyond the numbers equal interval variable - correct answer variable in which numbers stand for approx...
-
OTD 356 Exam 2 Questions and Answers
- Exam (elaborations) • 5 pages • 2024
-
Available in package deal
-
- $10.49
- + learn more
low vision rehab - Answer-bilateral vision impairment that can't be corrected by lenses, medication or surgery glaucoma, diabetic retinopathy neurologic vision therapy - Answer-addresses & rehabs vision changes that are secondary to neuro injury stroke, brain injury, TBI, etc. visual acuity - Answer-clarity of vision/ quality of vision visual fields - Answer-visual surround that can be seen when one looks straight ahead oculomotor control - Answer-efficient use of eyes toge...
-
Epidemiology Exam Review Questions with Verified Answers
- Exam (elaborations) • 5 pages • 2024
-
Available in package deal
-
- $10.49
- + learn more
What is the epidemic threshold for a disease? - ANSWER-the number of critical cases of a health-related issue, the level of the outbreak and what course of action should be taken to control it. How does power apply to statistical testing? - ANSWER-Power applies to statistical testing by demonstrating whether or not a study can convey an association if it exists. This is relates to sample size and effect size, the strength of an association observed. What is meant by bias in epidemiologic s...
-
PS 307 Exam | Questions with complete solutions
- Exam (elaborations) • 27 pages • 2024
-
- $21.99
- + learn more
PS 307 Exam | Questions with complete solutions A variable for which there is an infinite number of values between any two points on the scale is a ________ variable. a) Discrete b) Ratio c) Continuous d) Confounding A medical researcher interested in asthma symptoms wanted to know how symptoms were affected in dry versus humid conditions. The researchers recruited 18 asthma patients to spend four weeks under two conditions: sleeping with a dehumidifier for two weeks to create a "dry" enviro...

-
MODULE 4: DESCRIPTIVE STATISTICS FOR A SINGLE VARIABLE- VOCABULARY EXAM | QUESTIONS & 100% VERIFIED ANSWERS | LATEST UPDATE | PASSED
- Exam (elaborations) • 6 pages • 2024
-
- $9.99
- + learn more
MODULE 4: DESCRIPTIVE STATISTICS FOR A SINGLE VARIABLE- VOCABULARY EXAM | QUESTIONS & 100% VERIFIED ANSWERS | LATEST UPDATE | PASSED Non-numeric information based on some quality or characteristic. Correct Answer: qualitative data The most frequent value in a dataset. Correct Answer: mode A graphical display that shows data in categories as percentages of a circle. Correct Answer: pie chart Data values that are numbers, representing quantities that can be counted or measured. Corre...
-
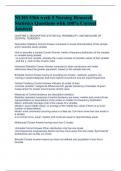
NURS 5366 week 5 Nursing Research Statistics Questions with 100% Correct Answers
- Exam (elaborations) • 12 pages • 2023
- Available in package deal
-
- $12.99
- + learn more
CHAPTER 3: DESCRIPTIVE STATISTICS, PROBABILITY, AND MEASURE OF CENTRAL TENDENCY Descriptive Statistics Correct Answer computed to reveal characteristics of the sample and to describe study variable How to describe a sample Correct Answer create a frequency distribution of the variable or variable being studied - is a plot of one variable, whereby the x-axis consists of possible values of that variable , and the y - axis is tally of each value Inferential Statistics Correct Answer comp...

Do you wonder why so many students wear nice clothes, have money to spare and enjoy tons of free time? Well, they sell on Stuvia! Imagine your study notes being downloaded a dozen times for $15 each. Every. Single. Day. Discover all about earning on Stuvia


