Boxplot - Study guides, Class notes & Summaries
Looking for the best study guides, study notes and summaries about Boxplot? On this page you'll find 224 study documents about Boxplot.
Page 4 out of 224 results
Sort by
-
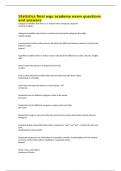
Statistics final wgu academy exam questions and answers
- Exam (elaborations) • 6 pages • 2024
- $10.09
- + learn more
Statistics final wgu academy exam questions and answers Categorical variables that there is no natural order among the categories nominal variables Categorical variables where there is natural order among the categories (low-high) ordinal variable A measurement which makes sense to talk about the difference between values but not the ratio between values interval Quantitive variables where is makes sense to talk about the difference in ratios. (Income, weight) ratio Valu...
-
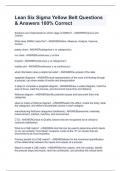
Lean Six Sigma Yellow Belt Questions & Answers 100% Correct
- Exam (elaborations) • 5 pages • 2024
- $11.99
- + learn more
Solutions are implemented in which stage of DMAIC? - ANSWERImprove and Control What does DMAIC stand for? - ANSWERDefine, Measure, Analyze, Improve, Control pareto chart - ANSWERcategorical x vs categorical y run chart - ANSWERcontinuous y vs time boxplot - ANSWERcontinuous y vs categorical x scatter plot - ANSWERcontinuous y vs continuous x what information does a dotplot provide? - ANSWERthe spread of the data spaghetti diagrams - ANSWERvisual representation of the work un...
-
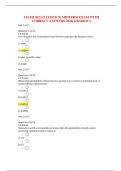
MATH 302| STATISTICS| MIDTERM EXAM WITH CORRECT ANSWERS 2024| GRADED A
- Exam (elaborations) • 10 pages • 2024
- $13.49
- + learn more
MATH 302| STATISTICS| MIDTERM EXAM WITH CORRECT ANSWERS 2024| GRADED A Part 1 of 9 - Question 1 of 25 1.0 Points For a boxplot, the vertical line inside the box indicates the location of the • A. mean • B. median • C. inter quartile range • D. mode Part 2 of 9 - Question 2 of 25 1.0 Points What is the probability of drawing two queens in a row from a standard deck of cards without replacement?
-
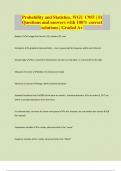
Probability and Statistics, WGU C955 | 51 Questions and answers with 100% correct solutions | Graded A+
- Exam (elaborations) • 6 pages • 2024
- $12.48
- + learn more
Boxplot an image that has min, Q1, median, Q3, max Histogram A graphical representation -- bars, measuring the frequency within each interval Skewed right Not a symmetric distribution, the tail is on the right, i.e. extra stuff on the right Measures of center Median, the mean (and mode) Measures of spread Range, IQR & standard deviation Standard Deviation Rule 68% of the data are within 1 standard deviation, 95% are within 2, 99.7 are within 3 standard deviations from the mean. For skewed...
-
Exst 2201 Lesson 2.2
- Exam (elaborations) • 3 pages • 2024
- $9.99
- + learn more
Exst 2201 Lesson 2.2 Why is it important to look at the shape of a column of data before interpreting any statistics? ️To see if the data is unimodal, symmetrical, and without any exceptions. Why look at a chart to get shape information instead of looking at the data values themselves? ️A chart is needed to summarize the shape characteristic so that we can see it. Match the two meanings below with their appropriate column titles in a frequency table. ️Count of the data values i...

Make study stress less painful


-
Statistics final wgu academy exam questions and answers
- Exam (elaborations) • 7 pages • 2024
- $11.49
- + learn more
Statistics final wgu academy exam questions and answers Categorical variables that there is no natural order among the categories - Answer- nominal variables Categorical variables where there is natural order among the categories (low-high) - Answer- ordinal variable A measurement which makes sense to talk about the difference between values but not the ratio between values - Answer- interval Quantitive variables where is makes sense to talk about the difference in ratios. (Income, weig...
-
Math 1060 UGA first term TEST with verified solutions.
- Exam (elaborations) • 5 pages • 2024
- $15.49
- + learn more
Qualitative data values categorized by traits that do not take a numerical value Quantitative data values that are measured Histogram graph of distribution of outcomes for a single numerical variable Outlier individual whose variable value falls outside of the overall pattern; outside 3 standard deviations Skewed Left longer tail of histogram is on the left side, most data is on the right Skewed Right longer tail of histogram is on the right side, most da...
-
Statistics final wgu academy exam questions and answers
- Exam (elaborations) • 7 pages • 2024
- $11.49
- + learn more
Statistics final wgu academy exam questions and answers Categorical variables that there is no natural order among the categories - Answer- nominal variables Categorical variables where there is natural order among the categories (low-high) - Answer- ordinal variable A measurement which makes sense to talk about the difference between values but not the ratio between values - Answer- interval Quantitive variables where is makes sense to talk about the difference in ratios. (Income, weig...
-
Qlik Sense Business Analyst Qualification Questions & Answers(RATED A+)
- Exam (elaborations) • 11 pages • 2024
- $12.99
- + learn more
Insight Advisor - ANSWERClicking on the Insight Advisor Button: Explore your Data (selecting fields or master items with Dimensions and Measures) Creation of analysis or ask questions in natural language. To leave the Insight Advisor click on the Insight Advisor and arrive at teh new sheet created with teh visualisations Auto complete query helps by suggestions of fields and values (if present). The Insight Advisor learnes from precedent Actions taken within the app. Generating Insights ...
-
MATH302 Week 2 Test
- Exam (elaborations) • 19 pages • 2023
- $29.49
- + learn more
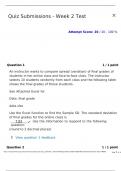
1. Question: An instructor wants to compare spread (variation) of final grades of students in her online class and face-to-face class. The instructor selects 10 students randomly from each class and the following table shows the final grades of those students. See Attached Excel for Data. 2. Question: The lengths (in kilometers) of rivers on the South Island of New Zealand that flow to the Tasman Sea are listed below. Find the variance. See Attached Excel for Data. Use the Excel function to fin...
