Box and whisker plot - Study guides, Class notes & Summaries
Looking for the best study guides, study notes and summaries about Box and whisker plot? On this page you'll find 217 study documents about Box and whisker plot.
Page 2 out of 217 results
Sort by
-
NSG-522 Midterm Exam Study Questions and Answers with Complete Solutions Graded A 2024
- Exam (elaborations) • 11 pages • 2024
- $11.49
- + learn more
The frequency and relative frequency presented as a percentage should both be reported when describing interval level data - False What type of graphic display would be the best for a variable measured at the ordinal data? - Histogram The operational definition of a variable - Specifies how a variable should be measured The epidemiological range is - the minimum and maximum values When reporting the mean for a variable, what measure of spread should be reported? - The standard deviat...
-
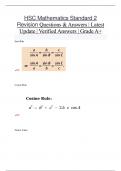
HSC Mathematics Standard 2 Revision Questions & Answers | Latest Update | Verified Answers | Grade A+
- Exam (elaborations) • 14 pages • 2024
- $11.49
- + learn more
Sine Rule :: Cosine Rule :: Future Value :: the amount of money in the future that an amount of money today will yield, given prevailing interest rates Trapezoidal rule :: Limit of reading :: smallest unit on the measuring instrument also known as precision. Absolute error :: ½ × limit of reading (maximum value) Interquartile Range (IQR) :: the difference between the first quartile and third quartile. Q3 - Q1 standard deviation :: a measure of the spread of data about the m...
-
QMB 210 University of Tampa Question with 100 % correct answers | Verified | updated
- Exam (elaborations) • 18 pages • 2024
- $7.99
- + learn more
addition rule - a mathematical rule used to calculate the probability of the union of events alpha - The probability of rejecting the null hypothesis when, in reality, it is true. Alternative hypothesis - Designated H1, this hypothesis represents the opposite of the null hypothesis and holds true if the null hypothesis is found to be false. The alternative hypothesis always states the population parameter is <, not equal (=/), or > a specific value. bar chart - A chart that displays q...

-
MATH 112 Shape of the Distribution
- Other • 22 pages • 2023
- $22.49
- + learn more
Department of Mathematics and Natural Sciences Shape of the Distribution 1/1 Measures of Shape Skewness measures the deviation from the symmetry. SK = 3(µ median) (1) SK = 3(¯x median) s (2) Example The scores of the students in the Prelim Exam has a median of 18 and a mean of 16. What does this indicate about the shape of the distribution of the scores? Math031 - Mathematics in the Modern World 2 Boxplot A boxplot is also called a box - and - whisker plot. It is a graphical...
-
NSG-522 Midterm Questions and Answers(A+ Solution guide) 2024 latest update
- Exam (elaborations) • 16 pages • 2023
- $8.49
- + learn more
The frequency and relative frequency presented as a percentage should both be reported when describing interval level data - False What type of graphic display would be the best for a variable measured at the ordinal data? - Histogram The operational definition of a variable - Specifies how a variable should be measured The epidemiological range is - the minimum and maximum values When reporting the mean for a variable, what measure of spread should be reported? - The standard deviation ...

Get paid weekly? You can!

-
NSG 522 Midterm Questions And Answers Latest Top Score.
- Exam (elaborations) • 12 pages • 2024
- $12.49
- + learn more
NSG 522 Midterm Questions And Answers Latest Top Score. The frequency and relative frequency presented as a percentage should both be reported when describing interval level data - correct answer.False What type of graphic display would be the best for a variable measured at the ordinal data? - correct answer.Histogram The operational definition of a variable - correct answer.Specifies how a variable should be measured The epidemiological range is - correct minimum and max...
-
CPH Exam – Biostatistics Questions and Answers 2024
- Exam (elaborations) • 64 pages • 2024
- $17.99
- + learn more
CPH Exam – Biostatistics Questions and Answers 2024 Biostatistics includes a set of principles and methods which allow us to ______, _______ and ______ important public health problems. assess, analyze and solve The application of biostatistics involves what? The application of biostatistics involves developing clear research questions, designing studies to collect relevant information or data, applying appropriate techniques to analyze those data and drawing meaningful conclusions f...
-
ISYE-6501 Exam 1 Questions And Answers With Verified Updates
- Exam (elaborations) • 15 pages • 2024
- $7.99
- + learn more
Data point - Observation/record of (perhaps multiple) measurements for a single member of a population or data set. In the standard tabular format, a row of data. Bayesian Information criterion (BIC) - Model selection technique that trades off model fit and model complexity. When comparing models, the model with lower BIC is preferred. Generally penalizes complexity more than AIC. 1-norm (rectilinear distance, Manhattan distance) - Think of distances in blocks E (|xi - yi|) 2-norm (euclide...
-
AP Statistics 1st Semester Final Exam Review Questions With Complete Solutions
- Exam (elaborations) • 6 pages • 2023
- $10.99
- + learn more
Name 3 categorical (qualitative) variables. correct answer: Favorite color/favorite candy/brand of car. Name 3 discrete quantitative variables. correct answer: How many shoes/how many siblings/how many pets. Name 3 continuous quantitative variables. correct answer: How long it takes to open a water bottle/amount of water draining in a tub/amount of rainfall in December. List the different graphical methods that can be used for categorical (qualitative) data. correct answer: Bar grap...
-
Test Bank For Business Statistics For Contemporary Decision Making 8th Edition By Black
- Exam (elaborations) • 626 pages • 2023
- $31.02
- + learn more
File: ch03, Chapter 3: Descriptive Statistics True/False 1. Statistical measures used to yield information about the center or the middle parts of a group of numbers are called the measures of central tendency. Ans: True Response: See section 3.1 Measures of Central Tendency: Ungrouped Data Difficulty: Easy Learning Objective: 3.1: Apply various measures of central tendency—including the mean, median, and mode—to a set of ungrouped data. 2. The most appropriate measure ...
