STAT 200
Liberty University
Page 2 out of 18 results
Sort by
-
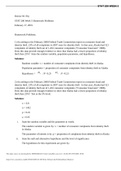
STAT 200 Week 5 Homework Problems Denize_Shy. (Approach-3), University of Maryland University College (UMUC) 1) According to the February 2008 Federal Trade Commission report on consumer fraud and identity theft, 23% of all complaints in 2007 were for ide
- Exam (elaborations) • 7 pages • 2022
- Available in package deal
-
- $17.99
- + learn more
STAT 200 Week 5 Homework Problems Denize_Shy. (Approach-3), University of Maryland University College (UMUC) 1) According to the February 2008 Federal Trade Commission report on consumer fraud and identity theft, 23% of all complaints in 2007 were for identity theft. In that year, Alaska had 321 complaints of identity theft out of 1,432 consumer complaints ("Consumer fraud and," 2008). Does this data provide enough evidence to show that Alaska had a lower proportion of identity theft than 23%...
-
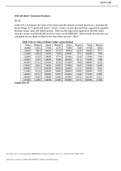
STAT 200 Week 7 Homework Problems Solutions (Approach-1), University of Maryland University College (UMUC)
- Exam (elaborations) • 9 pages • 2022
- Available in package deal
-
- $17.99
- + learn more
STAT 200 Week 7 Homework Problems 10.1.2 Table #10.1.6 contains the value of the house and the amount of rental income in a year that the house brings in ("Capital and rental," 2013). Create a scatter plot and find a regression equation between house value and rental income. Then use the regression equation to find the rental income a house worth $230,000 and for a house worth $400,000. Which rental income that you calculated do you think is closer to the true rental income? Why? Table ...
-
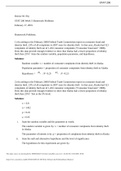
STAT 200 Week 5 Homework Problems Denize_Shy. (Approach-3), University of Maryland University College (UMUC)
- Exam (elaborations) • 7 pages • 2022
- Available in package deal
-
- $17.99
- + learn more
1) According to the February 2008 Federal Trade Commission report on consumer fraud and identity theft, 23% of all complaints in 2007 were for identity theft. In that year, Alaska had 321 complaints of identity theft out of 1,432 consumer complaints ("Consumer fraud and," 2008). Does this data provide enough evidence to show that Alaska had a lower proportion of identity theft than 23%? State the random variable, population parameter, and hypotheses. Solution: Random variable: x = number...
-
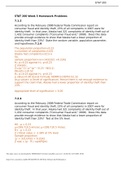
STAT 200 Week 5 Homework Problems Solution (Approach-1), University of Maryland University College (UMUC)
- Exam (elaborations) • 4 pages • 2022
- Available in package deal
-
- $17.99
- + learn more
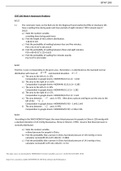
STAT 200 Week 5 Homework Problems 7.1.2 According to the February 2008 Federal Trade Commission report on consumer fraud and identity theft, 23% of all complaints in 2007 were for identity theft. In that year, Alaska had 321 complaints of identity theft out of 1,432 consumer complaints ("Consumer fraud and," 2008). Does this data provide enough evidence to show that Alaska had a lower proportion of identity theft than 23%? State the random variable, population parameter, and hypotheses...
-
STAT 200 Week 4 Homework Problems Solutions, University of Maryland University College (UMUC)
- Exam (elaborations) • 5 pages • 2022
- Available in package deal
-
- $15.99
- + learn more
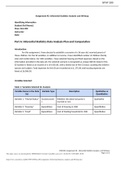
STAT 200 Week 4 Homework Problems 6.1.2 1.) The commuter trains on the Red Line for the Regional Transit Authority (RTA) in Cleveland, OH, have a waiting time during peak rush hour periods of eight minutes ("2012 annual report," 2012). a.) State the random variable. x=waiting time during peak hours b.) Find the height of this uniform distribution. 1/(8-0)=0.125 c.) Find the probability of waiting between four and five minutes. P(4<x<5)=(5-4)*0.125=0.125 d.) Find the probabilit...
-
STAT 200 Assignment 3 Inferential Statistics Analysis and Writeup, University of Maryland University College (UMUC)
- Other • 4 pages • 2022
- Available in package deal
-
- $16.99
- + learn more
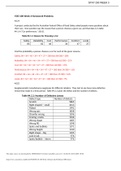
Assignment #3: Inferential Statistics Analysis and Writeup Identifying Information Student (Full Name): Class: Stat 200 Instructor: Date: Part A: Inferential Statistics Data Analysis Plan and Computation Introduction: For this assignment, I have elected to establish a scenario of a 36 year old, married parent of three children. For the SE variables, in addition to income, I have identified number of children (family size) and marital status. For USD variables, I have selected housing a...
-
STAT 200 Week 3 Homework Problems Solutions, University of Maryland University College (UMUC)
- Exam (elaborations) • 4 pages • 2022
- Available in package deal
-
- $15.99
- + learn more
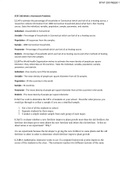
STAT 200 Week 3 Homework Problems 4.1.4 A project conducted by the Australian Federal Office of Road Safety asked people many questions about their cars. One question was the reason that a person chooses a given car, and that data is in table #4.1.4 ("Car preferences," 2013). Table #4.1.4: Reason for Choosing a Car Safety Reliability Cost Performance Comfort Looks 84 62 46 34 47 27 Find the probability a person chooses a car for each of the given reasons. Safety: 84 + 64 + 46 + 34 + 4...
-
STAT 200 Week 1 Homework Problems Solutions, University of Maryland University College (UMUC)
- Exam (elaborations) • 4 pages • 2022
- Available in package deal
-
- $15.99
- + learn more
STAT 200 Week 1 Homework Problems 1.1.4 To estimate the percentage of households in Connecticut which use fuel oil as a heating source, a researcher collects information from 1000 Connecticut households about what fuel is their heating source. State the individual, variable, population, sample, parameter, and statistic Individual - Households in Connecticut. Variable - Percentage of households in Connecticut which use fuel oil as a heating source. Population - All responses from the sample...

$6.50 for your textbook summary multiplied by 100 fellow students... Do the math: that's a lot of money! Don't be a thief of your own wallet and start uploading yours now. Discover all about earning on Stuvia


