study pool
WE OFFER WELL RESEARCHED , CREDIBALE READING AND REVISION MATERIALS .
PAST PAPERS , EXAMS , TEST PAPERS AND QUIZ PAPERS ALL AVAILABLE
NURSING
MED SURG
SOFTWARE ENGINEERING
ENGINEERING
ECONOMICS
LAW
ART
BIOLOGY
MATH
CHEMISTRY
ETC.
- 453
- 0
- 17
Community
- Followers
- Following
1 Reviews received
470 items

MATH 1280 Milestone 3_Introduction to Statistics (2020)
Which of the following statements is TRUE? • If Tracie spins the spinner 1,000 times, it would land on red close to 250 times. • If Tracie spins the spinner 1,000 times, the relative frequency of it landing on red will remain constant. • If Tracie spins the spinner 4 times, it will land on red at least once. • The theoretical probability of the spinner landing on red will change with every spin completed
- Exam (elaborations)
- • 27 pages •
Which of the following statements is TRUE? • If Tracie spins the spinner 1,000 times, it would land on red close to 250 times. • If Tracie spins the spinner 1,000 times, the relative frequency of it landing on red will remain constant. • If Tracie spins the spinner 4 times, it will land on red at least once. • The theoretical probability of the spinner landing on red will change with every spin completed
MATH 1280 Milestone 2_Introduction to Statistics (2020)
Hannah noted the height of each student in her class and found that the mean height of the students is 56 inches, with a standard deviation of 1.2 inches. The height of one of the students, James, is 59 inches. What is the z-score for James' height? • 2.5 • -2.5 • 3.6 • -3.6 RATIONALE Recall that the z-score can be calculated with the following formula
- Exam (elaborations)
- • 23 pages •
Hannah noted the height of each student in her class and found that the mean height of the students is 56 inches, with a standard deviation of 1.2 inches. The height of one of the students, James, is 59 inches. What is the z-score for James' height? • 2.5 • -2.5 • 3.6 • -3.6 RATIONALE Recall that the z-score can be calculated with the following formula

MED SURG 2 Respiratory and Renal study guide Yale University
Respiratory and Renal study guide
- Exam (elaborations)
- • 8 pages •
Respiratory and Renal study guide
Med SURG 2 Final HESI review 2020 Yale University
• Hypothyroid- high TSH (trying to stimulate thyroid to work), low T3 and T4 o Everything slows down (bowel movements), hair falls out, dry skin, fat, fatigue, Puffy face o Give synthroid in morning before meals (at same time) o Myxedema (opposite of thyroid storm) – decrease mental status, hypothermia, slowing of organ function o After a thyroidectomy, a client is at risk for developing hypocalcemia. Trousseau sign (carpal spasm w BP cuff)
- Exam (elaborations)
- • 26 pages •
• Hypothyroid- high TSH (trying to stimulate thyroid to work), low T3 and T4 o Everything slows down (bowel movements), hair falls out, dry skin, fat, fatigue, Puffy face o Give synthroid in morning before meals (at same time) o Myxedema (opposite of thyroid storm) – decrease mental status, hypothermia, slowing of organ function o After a thyroidectomy, a client is at risk for developing hypocalcemia. Trousseau sign (carpal spasm w BP cuff)

MB 101_Bloomberg Answers - Economic Indicators _ Harvard University
The Primacy of GDP (30 min.) Knowledge Check 1 How accurately do GDP statistics portray the economy and why? Inaccurately because the scope of GDP measurements can change. Knowledge Check 2 Consider the formula GDP = C + I + (X-M). A country is undergoing a boom in consumption of domestic and foreign luxury goods. In one year, the dollar growth in imports is greater than the dollar growth in domestic consumption. Assuming nothing else has changed, what happened to GDP? It went d...
- Exam (elaborations)
- • 13 pages •
The Primacy of GDP (30 min.) Knowledge Check 1 How accurately do GDP statistics portray the economy and why? Inaccurately because the scope of GDP measurements can change. Knowledge Check 2 Consider the formula GDP = C + I + (X-M). A country is undergoing a boom in consumption of domestic and foreign luxury goods. In one year, the dollar growth in imports is greater than the dollar growth in domestic consumption. Assuming nothing else has changed, what happened to GDP? It went d...
MATH 1280 Self - Quiz Unit 2 – Harvard University
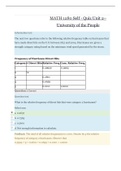
What is the relative frequency of direct hits that were category 2 hurricanes? Select one: a. 0.2637 b. 0.7363 c. 0.2601 d. Not enough information to calculate.
- Exam (elaborations)
- • 13 pages •
What is the relative frequency of direct hits that were category 2 hurricanes? Select one: a. 0.2637 b. 0.7363 c. 0.2601 d. Not enough information to calculate.
MATH 1280 Practice Milestone UNIT 1 Introduction to Statistics (2020)_aHarvard University
Which of the following data types will be continuous? • Number of cars produced by a car company in a year • Number of skyscrapers in a city • Number of correct answers on a ten-question true/false test • Weight of a baby whale RATIONALE For data to be continuous, it means it can take on any value inside of an interval. Since the weight of a baby whale can take on any numerical value inside of possible ranges of weights, it is continuous
- Exam (elaborations)
- • 22 pages •
Which of the following data types will be continuous? • Number of cars produced by a car company in a year • Number of skyscrapers in a city • Number of correct answers on a ten-question true/false test • Weight of a baby whale RATIONALE For data to be continuous, it means it can take on any value inside of an interval. Since the weight of a baby whale can take on any numerical value inside of possible ranges of weights, it is continuous
MATH 1280 Graded Exam Unit 8 test questions only (2020)
Recall that the population average of the heights in the file "" is μ = 170.035. Using simulations we found that the probability of the sample average of the height falling within 1 centimeter of the population average is approximately equal to 0.626. From the simulations we also got that the standard deviation of the sample average is (approximately) equal to 1.122. In the next 3 questions you are asked to apply the Normal approximation to the distribution of the sample average usi...
- Exam (elaborations)
- • 9 pages •
Recall that the population average of the heights in the file "" is μ = 170.035. Using simulations we found that the probability of the sample average of the height falling within 1 centimeter of the population average is approximately equal to 0.626. From the simulations we also got that the standard deviation of the sample average is (approximately) equal to 1.122. In the next 3 questions you are asked to apply the Normal approximation to the distribution of the sample average usi...
MATH 225N Week 5 Normal Distribution – Discussion (2020) (NURSING)
According to Holmes, A. and Dean, S. (2019), a normal distribution is a bell-shaped, symmetrical, unimodal, the mean and median are equal, and 68% of the data falls within 1 standard deviation. The mean is location of the line of symmetry and the standard deviation is the spread of the data. Two variables that I work with daily are height and weight. I use these in my state required assessments for medical necessity level of care.
- Exam (elaborations)
- • 2 pages •
According to Holmes, A. and Dean, S. (2019), a normal distribution is a bell-shaped, symmetrical, unimodal, the mean and median are equal, and 68% of the data falls within 1 standard deviation. The mean is location of the line of symmetry and the standard deviation is the spread of the data. Two variables that I work with daily are height and weight. I use these in my state required assessments for medical necessity level of care.
MATH 225N Week 5 Lab Assignment ( nursing)
Step 1: Survey or measure 10 people to find their heights. Determine the mean and standard deviation for this group by using the Week 3 Excel spreadsheet. Post a screen shot of the portion of the spreadsheet that helped you determine these values. How does your height compare to the mean (average) height of the group that you surveyed? Is your height taller, shorter, or the same as the mean of your group?
- Exam (elaborations)
- • 5 pages •
Step 1: Survey or measure 10 people to find their heights. Determine the mean and standard deviation for this group by using the Week 3 Excel spreadsheet. Post a screen shot of the portion of the spreadsheet that helped you determine these values. How does your height compare to the mean (average) height of the group that you surveyed? Is your height taller, shorter, or the same as the mean of your group?

ATI PN MENTAL HEALTH PROCTORED EXAM 2020