Tb ch03 - Study guides, Class notes & Summaries
Looking for the best study guides, study notes and summaries about Tb ch03? On this page you'll find 4 study documents about Tb ch03.
All 4 results
Sort by
-
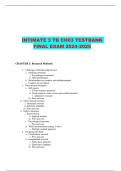
INTIMATE 3 TB CH03 TESTBANK FINAL EXAM 2024-2025
- Exam (elaborations) • 16 pages • 2024
- $12.49
- + learn more
INTIMATE 3 TB CH03 TESTBANK FINAL EXAM ...
-
Joel Adv Practice NSG, 4e CH03 TB Chapter 3: Role Development: A Theoretical Perspective
- Exam (elaborations) • 8 pages • 2024
- $9.49
- + learn more
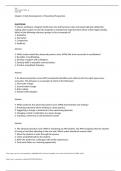
QUESTIONS 1. Nurses working in a Magnet facility have low staff turnover rates and report high job satisfaction, making others aspire to have the longevity in employment experienced by those at the Magnet facility. Which of the following reference groups is this an example of? 1. Evaluative 2. Normative 3. Comparison 4. Audience Answer: 2. Which action should the advanced practice nurse (APN) take to be successful in socialization? 1. Be better at multitasking. 2. Develop a rapport wi...

-
Adv Practice NSG, 4e CH03 TB Chapter 3: Role Development: A Theoretical Perspective
- Exam (elaborations) • 8 pages • 2024
- $9.49
- + learn more
QUESTIONS 1. Nurses working in a Magnet facility have low staff turnover rates and report high job satisfaction, making others aspire to have the longevity in employment experienced by those at the Magnet facility. Which of the following reference groups is this an example of? 1. Evaluative 2. Normative 3. Comparison 4. Audience Answer: 2. Which action should the advanced practice nurse (APN) take to be successful in socialization? 1. Be better at multitasking. 2. Develop a rapport wi...
-
Kaplan Saccuzzo 9e TB Ch03
- Exam (elaborations) • 23 pages • 2024
- $11.29
- + learn more
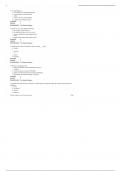
1. A scatter diagram is a. a bivariate plot of individual data points. b. a univariate plot of individual data points c. a form of the stem and leaf display. d. a method of calculating variance. ANSWER: a POINTS: 1 REFERENCES: The Scatter Diagram 2. Each point on a scatter diagram represents a. the variance of a set of scores. b. the standard deviation of a set of scores. c. where an individual scored compared to the mean. d. where an individual scored on both x and y. ANSWER: d POINTS: ...

Fear of missing out? Then don’t!

