Stem and leaf plot show - Study guides, Class notes & Summaries
Looking for the best study guides, study notes and summaries about Stem and leaf plot show? On this page you'll find 109 study documents about Stem and leaf plot show.
All 109 results
Sort by
 Popular
-
Solution Manual for Essentials of Modern Business Statistics with Microsoft® Excel®, Anderson
- Exam (elaborations) • 817 pages • 2024
-
- $47.09
- 1x sold
- + learn more
Solution Manual for Essentials of Modern Business Statistics withMicrosoft® Excel®,Anderson Chapter 1 Data and Statistics Learning Objectives 1. Obtain an appreciation for the breadth of statistical applications in business and economics. 2. Understand the meaning of the terms elements, variables, and observations as they are used in statistics. 3. Obtain an understanding of the difference between categorical, quantitative, crossectional and time series data. 4. Learn about the sou...
-
MIP2602 ASSIGNMENT 4 2023
- Other • 10 pages • 2023
-
- $2.95
- 2x sold
- + learn more
Question 1 1.1 What type(s) of data are best for using the following? 1.1.1 A stem-and-leaf plot: Stem-and-leaf plots are best suited for displaying small to moderate-sized datasets of quantitative data. They help you understand the distribution of the data and show individual data points.

-
Biology: The Core 3rd Edition Exam Questions and 100% Correct Answers| Eric J. Simon
- Exam (elaborations) • 110 pages • 2023
-
Available in package deal
-
- $17.99
- 3x sold
- + learn more
***Download Test Bank Immediately After the Purchase. Just in case you have trouble downloading, kindly message me, and I will send it to you via Google Doc or email. Thank you*** Biology: The Core 3rd Edition Exam Questions and 100% Correct Answers| Eric J. Simon The Test Bank for Biology: The Core, 3rd Edition by Eric J. Simon is a comprehensive study tool designed to aid in the understanding of fundamental concepts in biology. It contains a series of questions and answers that align with th...
-
WGU C955 Applied Probability and Statistics Final Exam (New 2023/ 2024 Update) Questions and Verified Answers_ 100% Correct_ Graded A
- Exam (elaborations) • 38 pages • 2024
-
Available in package deal
-
- $10.99
- + learn more
WGU C955 Applied Probability and Statistics Final Exam (New 2023/ 2024 Update) Questions and Verified Answers_ 100% Correct_ Graded A QUESTION what are the four graphical displays for quantitative data? Answer: dot plot, stem plot( or steam and leaf plot), box plot, and histogram QUESTION best to display the distribution of data, particularly clusters, gaps, and outliers. Most useful for smaller data sets Answer: dot plot QUESTION best to display the distr...
-
WGU C955 Applied Probability and statistics Exam Study Guide
- Exam (elaborations) • 15 pages • 2024
-
- $8.00
- + learn more
Pie chart numerical measure: percentages best used When displaying categories as parts of the whole Bar chart (bar graph) Category counts or frequencies best used when displaying counts or frequencies for each category individually Dot Plot 5-number summary (max, Q1, median, Q3, max) Smaller data set; useful to display the distribution and show gaps and outliers (quantitative) Stem Plot (stem-and-leaf plot) 5-number summary (max, Q1, median, Q3, max) Smaller data sets; useful to disp...
-
ABCTE Elementary Education Exam 206 Questions with Verified Answers,100% CORRECT
- Exam (elaborations) • 20 pages • 2023
-
Available in package deal
-
- $7.99
- 1x sold
- + learn more
ABCTE Elementary Education Exam 206 Questions with Verified Answers Magna Carta - CORRECT ANSWER (1215) a charter of liberties (freedoms) that King John "Lackland" of Englad was forced to sign; it made the king obey the same laws as the citizens of his kingdom 13th Ammendment - CORRECT ANSWER officially abolished slavery, prohibits involuntary servitude. Articles of Confederation - CORRECT ANSWER 1st Constitution of the U.S. (weaknesses-no executive, no judicial, no power to tax, n...
-
AP Statistics Final Exam Study Questions 2024.
- Exam (elaborations) • 24 pages • 2024
-
Available in package deal
-
- $12.99
- + learn more
AP Statistics Final Exam Study Questions 2024. What is a dot plot? - correct answer A graphical display which shows "dots" for each point. It's good for categorical data- ie data classified into categories. What's the difference between categorical and quantitative data? - correct answer Categorical data fits into various categories; whereas, quantitative data has numerical values associated with it. What is a bar chart? - correct answer A display for categorical data which indicates ...
-
AP Statistics Exam Review Questions With Complete Solutions
- Exam (elaborations) • 33 pages • 2023
-
Available in package deal
-
- $12.99
- + learn more
What is a dotplot? correct answer: A graphical display which shows "dots" for each point. It's good for categorical data- ie data classified into categories. What's the difference between categorical and quantitative data? correct answer: Categorical data fits into various categories; whereas, quantitative data has numerical values associated with it. What is a bar chart? correct answer: A display for categorical data which indicates frequencies or percents for each category. Wha...
-
AP Statistics Exam Review 2023 verified to pass
- Exam (elaborations) • 24 pages • 2023
- Available in package deal
-
- $18.49
- + learn more
AP Statistics Exam ReviewWhat is a dot plot? - correct answer A graphical display which shows "dots" for each point. It's good for categorical data- ie data classified into categories. What's the difference between categorical and quantitative data? - correct answer Categorical data fits into various categories; whereas, quantitative data has numerical values associated with it. What is a bar chart? - correct answer A display for categorical data which indicates frequencies or percents...
-
MAT 232 Midterm Exam Questions With Correct Answers Latest Updated 2024 (GRADED)
- Exam (elaborations) • 27 pages • 2024
-
- $15.49
- + learn more
MAT 232 Midterm Exam Questions With Correct Answers Latest Updated 2024 (GRADED) What is a sample statistic, what is a population parameter, and what is the difference between them? What is a sample statistic? A. A sample statistic is a range of likely values that a population parameter could take. B. A sample statistic is a numerical value describing some attribute of a population. C. A sample statistic is a numerical value describing some attribute of a sample. This is the correct answer ...
-
MATH302 Week 2 Test
- Other • 19 pages • 2023
- Available in package deal
-
- $35.99
- + learn more
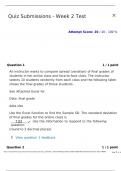
1. Question: An instructor wants to compare spread (variation) of final grades of students in her online class and face-to-face class. The instructor selects 10 students randomly from each class and the following table shows the final grades of those students. See Attached Excel for Data. 2. Question: The lengths (in kilometers) of rivers on the South Island of New Zealand that flow to the Tasman Sea are listed below. Find the variance. See Attached Excel for Data. Use the Excel function to fin...

$6.50 for your textbook summary multiplied by 100 fellow students... Do the math: that's a lot of money! Don't be a thief of your own wallet and start uploading yours now. Discover all about earning on Stuvia


