Stat 200 week 3 homework Study guides, Class notes & Summaries
Looking for the best study guides, study notes and summaries about Stat 200 week 3 homework? On this page you'll find 139 study documents about Stat 200 week 3 homework.
All 139 results
Sort by
-
STAT 200 Week 3 Homework Problems
- Exam (elaborations) • 6 pages • 2023
- $13.99
- + learn more
STAT 200 Week 3 Homework Problems

-
STAT 200 Week 3 Homework Problems
- Exam (elaborations) • 6 pages • 2022
- $7.99
- + learn more
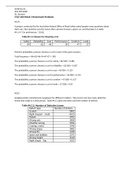
STAT 200 Week 3 Homework Problems. A project conducted by the Australian Federal Office of Road Safety asked people many questions about their cars. One question was the reason that a person chooses a given car, and that data is in table #4.1.4 ("Car preferences," 2013). Table #4.1.4: Reason for Choosing a Car Safety Reliability Cost Performance Comfort Looks 84 62 46 34 47 27 Find the probability a person chooses a car for each of the given reasons. Total: 84+62+46+34+47+27=300 Safety...
-
STAT 200 Week 3 Homework Problems Solutions, University of Maryland University College (UMUC) STAT 200 Week 3 Homework Problems 4.1.4 A project conducted by the Australian Federal Office of Road Safety asked people many questions about their cars. One que
- Package deal • 4 items • 2022
- $16.09
- + learn more
STAT 200 Week 3 Homework Problems Solutions, University of Maryland University College (UMUC) STAT 200 Week 3 Homework Problems 4.1.4 A project conducted by the Australian Federal Office of Road Safety asked people many questions about their cars. One question was the reason that a person chooses a given car, and that data is in table #4.1.4 ("Car
-
STAT 200 Week 2 Homework Problems and Solutions _ All Answers are Correct
- Exam (elaborations) • 8 pages • 2023
- $9.99
- + learn more
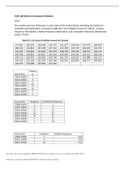
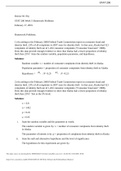
STAT 200 Week 2 Homework Problems 2.2.2 The median incomes of females in each state of the United States, including the District of Columbia and Puerto Rico, are given in table #2.2.10 ("Median income of," 2013). Create a frequency distribution, relative frequency distribution, and cumulative frequency distribution using 7 classes. Table #2.2.10: Data of Median Income for Females $31,862 $40,550 $36,048 $30,752 $41,817 $40,236 $47,476 $40,500 $60,332 $33,823 $35,438 $37,242 $31,238 $39...
-
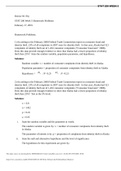
STAT 200 Week 5 Homework Problems Denize_Shy. (Approach-3), University of Maryland University College (UMUC) 1) According to the February 2008 Federal Trade Commission report on consumer fraud and identity theft, 23% of all complaints in 2007 were for ide
- Exam (elaborations) • 7 pages • 2022
- $17.99
- + learn more
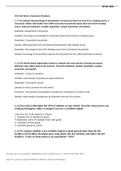
STAT 200 Week 5 Homework Problems Denize_Shy. (Approach-3), University of Maryland University College (UMUC) 1) According to the February 2008 Federal Trade Commission report on consumer fraud and identity theft, 23% of all complaints in 2007 were for identity theft. In that year, Alaska had 321 complaints of identity theft out of 1,432 consumer complaints ("Consumer fraud and," 2008). Does this data provide enough evidence to show that Alaska had a lower proportion of identity theft than 23%...

Fear of missing out? Then don’t!


-
STAT 200 Week 3 Homework Problems.
- Exam (elaborations) • 7 pages • 2022
- $9.49
- + learn more
STAT 200 Week 3 Homework Problems 4.1.4 A project conducted by the Australian Federal Office of Road Safety asked people many questions about their cars. One question was the reason that a person chooses a given car, and that data is in table #4.1.4 ("Car preferences," 2013). Table #4.1.4: Reason for Choosing a Car Safety Reliability Cost Performance Comfort Looks 84 62 46 34 47 27 Find the probability a person chooses a car for each of the given reasons. Total frequency = 84+62+46+3...
-
STAT 200 Week 3 Homework Problems
- Exam (elaborations) • 7 pages • 2022
- $10.58
- + learn more
A project conducted by the Australian Federal Office of Road Safety asked people many questions about their cars. One question was the reason that a person chooses a given car, and that data is in table #4.1.4 ("Car preferences," 2013). Table #4.1.4: Reason for Choosing a Car Safety Reliability Cost Performance Comfort Looks 84 62 46 34 47 27 Find the probability a person chooses a car for each of the given reasons. Total frequency = 84+62+46+34+47+27 = 300 The probability a person ch...
-
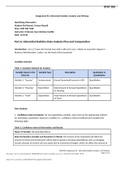
STAT 200 Week 4 Homework Problems Solutions, University of Maryland University College (UMUC) STAT 200 Week 4 Homework Problems 6.1.2 1.) The commuter trains on the Red Line for the Regional Transit Authority (RTA) in Cleveland, OH, have a waiting time du
- Exam (elaborations) • 5 pages • 2022
- $15.99
- + learn more
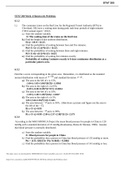
STAT 200 Week 4 Homework Problems Solutions, University of Maryland University College (UMUC) STAT 200 Week 4 Homework Problems 6.1.2 1.) The commuter trains on the Red Line for the Regional Transit Authority (RTA) in Cleveland, OH, have a waiting time during peak rush hour periods of eight minutes ("2012 annual report," 2012). a.) State the random variable. x=waiting time during peak hours b.) Find the height of this uniform distribution. 1/(8-0)=0.125 c.) Find the probability of waiting bet...
-
STAT 200 Week 1 Homework Problems Solutions, University of Maryland University College (UMUC) STAT 200 Week 1 Homework Problems 1.1.4 To estimate the percentage of households in Connecticut which use fuel oil as a heating source, a researcher collects inf
- Exam (elaborations) • 4 pages • 2022
- $16.39
- + learn more
STAT 200 Week 1 Homework Problems Solutions, University of Maryland University College (UMUC) STAT 200 Week 1 Homework Problems 1.1.4 To estimate the percentage of households in Connecticut which use fuel oil as a heating source, a researcher collects information from 1000 Connecticut households about what fuel is their heating source. State the individual, variable, population, sample, parameter, and statistic Individual - Households in Connecticut. Variable - Percentage of households in Conne...
-
STAT 200 Week 5 Homework Problems Denize_Shy. (Approach-3), University of Maryland University College (UMUC)
- Exam (elaborations) • 7 pages • 2022
- $17.99
- + learn more
1) According to the February 2008 Federal Trade Commission report on consumer fraud and identity theft, 23% of all complaints in 2007 were for identity theft. In that year, Alaska had 321 complaints of identity theft out of 1,432 consumer complaints ("Consumer fraud and," 2008). Does this data provide enough evidence to show that Alaska had a lower proportion of identity theft than 23%? State the random variable, population parameter, and hypotheses. Solution: Random variable: x = number...
