Hlt 362v module 3 - Study guides, Class notes & Summaries
Looking for the best study guides, study notes and summaries about Hlt 362v module 3? On this page you'll find 4 study documents about Hlt 362v module 3.
All 4 results
Sort by

-
HLT 362V-Statistics Module 3 Exercises 31 And 32.
- Exam (elaborations) • 8 pages • 2022
-
- $5.49
- + learn more
HLT 362V-Statistics Module 3 Exercises 31 And 32. Exercise 31 1. Do the example data meet the assumptions for the independent samples t -test? Provide a rationale for your answer. Yes, the data meet the assumptions for the independent samples t-test because the sample population is within standard distribution, there is equal variances between the two samples and the observations are independent. 2. If calculating by hand, draw the frequency distributions of the dependent variable, wages ...

-
HLT 362V Module 3 Exercises 31 And 32
- Exam (elaborations) • 8 pages • 2022
-
- $7.99
- + learn more
HLT 362V Module 3 Exercises 31 And 32. Do the example data meet the assumptions for the independent samples t -test? Provide a rationale for your answer. Yes, the data meet the assumptions for the independent samples t-test because the sample population is within standard distribution, there is equal variances between the two samples and the observations are independent. 2. If calculating by hand, draw the frequency distributions of the dependent variable, wages earned. What is the shap...

-
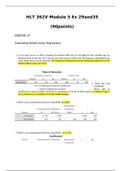
HLT 362V Module 5 Exercise 29and35 (90points)
- Exam (elaborations) • 4 pages • 2021
-
- $12.49
- + learn more
HLT 362V Module 5 Ex 29and35 (90points) EXERCISE 29 Calculating Simple Linear Regressions 1. If you have access to SPSS, compute the Shapiro-Wilk test of normality for the variable age (as demonstrated in Exercise 26). If you do not have access to SPSS, plot the frequency distributions by hand. What do the results indicate? The frequency distribution was not statistically significant as the Shapiro-Wilk p value was 0.357. Tests of Normality Kolmogorov-Smirnova Shapiro-Wilk Statis...

-
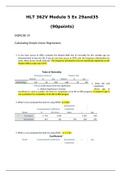
HLT 362V Module 5 Ex 29and35 (90points)
- Exam (elaborations) • 4 pages • 2021
-
- $15.49
- + learn more
HLT 362V Module 5 Ex 29and35 (90points) EXERCISE 29 Calculating Simple Linear Regressions 1. If you have access to SPSS, compute the Shapiro-Wilk test of normality for the variable age (as demonstrated in Exercise 26). If you do not have access to SPSS, plot the frequency distributions by hand. What do the results indicate? The frequency distribution was not statistically significant as the Shapiro-Wilk p value was 0.357. Tests of Normality Kolmogorov-Smirnova Shapiro-Wilk Statis...

$6.50 for your textbook summary multiplied by 100 fellow students... Do the math: that's a lot of money! Don't be a thief of your own wallet and start uploading yours now. Discover all about earning on Stuvia


