Graphs in aba - Study guides, Class notes & Summaries
Looking for the best study guides, study notes and summaries about Graphs in aba? On this page you'll find 135 study documents about Graphs in aba.
All 135 results
Sort by
 Popular
-
SPCE 630 Exam 1 Questions and Answers 100% Pass
- Exam (elaborations) • 15 pages • 2023
- $9.99
- 1x sold
- + learn more
SPCE 630 Exam 1 Questions and Answers 100% Pass Inconsistent implementation of condition protocols refers to which threat to internal validity? procedural infidelity Which level of scientific understanding includes observation and accurate description of phenomena? description Which level of scientific understanding refers to observing the correlation between two variables? hypothesis Which level of scientific understanding refers to reliable change produced by change in the IV? control SCR...
-
RBT Exam Prep Questions & Answers Latest Updated
- Exam (elaborations) • 75 pages • 2023
- $12.99
- 1x sold
- + learn more
B) a science that uses the principles of learning or behavior to change socially important behaviors - Answer the "true definition of ABA is: A) a type of therapy B) a science that uses the principles of learning or behavior to change socially important behaviors C) a theory that states people are not free D) none of the above true - Answer TRUE OR FALSE: ABA takes the findings of BF Skinner's experiments and applies those theories of learning (operant conditioning) to human bei...
-
QABA Exam practice questions taken from Relias training_2023_ANSWRED WITH FEEDBACKS.
- Exam (elaborations) • 22 pages • 2022
- $12.09
- 8x sold
- + learn more
QABA Exam practice questions taken from Relias training_2023. *If you have an individual who engages in escape behaviors you should:* A. Alternate antecedent interventions daily to see which ones are the most effective. B. Provide all antecedent interventions that can prevent escape. C. Tailor antecedent interventions to the person you support based on data from the FBA. D. Choose 3 antecedent interventions for escape maintained behaviors *After cleaning up a work area contaminated wi...
-
Graphs in ABA Questions and Answers | Latest Version | 2024/2025 | Graded A+
- Exam (elaborations) • 6 pages • 2024
- $10.10
- + learn more
Graphs in ABA Questions and Answers | Latest Version | 2024/2025 | Graded A+ What is the primary purpose of using graphs in ABA? The primary purpose of using graphs in ABA is to visually represent data to analyze and evaluate behavior changes over time. What type of graph is commonly used to display the frequency of behaviors? A line graph is commonly used to display the frequency of behaviors across different time points. How can a bar graph be useful in ABA? A bar graph can b...
-
Graphs in ABA Questions and Answers well Explained Latest 2024/2025 Update 100% Correct.
- Exam (elaborations) • 2 pages • 2024
- $7.99
- + learn more
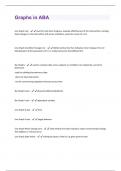
Line Graph Use - used to track client progress, evaluate effectiveness of the intervention, tracking daily changes in rate both within and across conditions, presents results of a F.A. Line Graph Condition Change Line - dotted vertical line that indicates minor change in the I.V. Manipulation of the parameters of I.V. or unplanned event that affected D.V. Bar Graphs - used to compare data across subjects or conditions not related by a common dimension. used for plotting discontinuous data....

Make study stress less painful

-
Graphs in ABA Study Guide Test.
- Exam (elaborations) • 2 pages • 2024
- $11.49
- + learn more
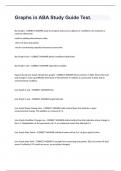
Graphs in ABA Study Guide Test. Bar Graphs - CORRECT ANSWER used to compare data across subjects or conditions not related by a common dimension. used for plotting discontinuous data. -does not have data points -not for summarizing repeated measures across time Bar Graph X-axis - CORRECT ANSWER phase/condition/satisfaction Bar Graph Y-axis - CORRECT ANSWER dependent variable Equal Interval Line Graph (simple line graph) - CORRECT ANSWER Most common in ABA. Shows the level and ch...
-
FIT BCBA Mock Exam Questions and Answers Graded A+
- Exam (elaborations) • 76 pages • 2023
- $48.49
- 6x sold
- + learn more
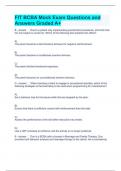
FIT BCBA Mock Exam Questions and Answers Graded A+ B Due to a parent only implementing punishment procedures, she finds that her son begins to avoid her. Which of the following best explains this effect? A) The parent became a discriminative stimulus for negative reinforcement. B) The parent became a conditioned aversive stimulus. C) The parent elicited emotional responses. D) The parent became an unconditioned aversive stimulus. D When teaching a client to enga...
-
BCBA Exam practice Questions And Answers With Verified Solutions Graded A+
- Exam (elaborations) • 15 pages • 2024
- $7.99
- + learn more
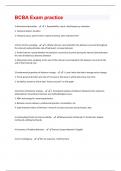
3 dimensional quantities - 1. Repeatability: count, rate/frequency, celeration 2. Temporal Extent: duration 3. Temporal Locus: point in time; response latency, inter-response time 3 forms of time sampling - 1. Whole interval: record whether the behavior occurred throughout the interval (underestimates rate of behavior); increase behavior 2. Partial interval: record whether the behavior occurred at any time during the interval (overestimates the rate of behavior); decrease behavior 3. Mome...
-
ABA Data Collection, Graphing Questions and Answers | Latest Version | 2024/2025 | Graded A+
- Exam (elaborations) • 11 pages • 2024
- $10.10
- + learn more
ABA Data Collection, Graphing Questions and Answers | Latest Version | 2024/2025 | Graded A+ What is the purpose of data collection in ABA? The purpose of data collection in ABA is to track behavior changes, evaluate the effectiveness of interventions, and guide decision-making. What types of data can be collected in ABA? Types of data collected in ABA include frequency, duration, latency, and interval data. How is frequency data recorded? Frequency data is recorded by coun...

-
Graphs in ABA Study Guide with Complete Solutions Bar Graphs - Answer️️ -used to compare data across subjects or conditions not related by a common dimension. used for plotting discontinuous data. -does not have data points -not for summarizing repeated m
- Exam (elaborations) • 3 pages • 2024
- $9.99
- + learn more
Graphs in ABA Study Guide with Complete Solutions Bar Graphs - Answer️️ -used to compare data across subjects or conditions not related by a common dimension. used for plotting discontinuous data. -does not have data points -not for summarizing repeated measures across time Bar Graph X-axis - Answer️️ -phase/condition/satisfaction Bar Graph Y-axis - Answer️️ -dependent variable Equal Interval Line Graph (simple line graph) - Answer️️ -Most common in ABA. Shows the level...
