Dataset split - Study guides, Class notes & Summaries
Looking for the best study guides, study notes and summaries about Dataset split? On this page you'll find 100 study documents about Dataset split.
All 100 results
Sort by
-
BUSI 820 Quantitative Analysis; DESCRIPTIVE STATISTICS, ORDINAL SCALE AND DICHOTOMOUS VARIABLE 2024 with complete solution; Liberty University
- Exam (elaborations) • 17 pages • 2024
-
- $15.49
- + learn more
BUSI 820 Quantitative Analysis; DESCRIPTIVE STATISTICS, ORDINAL SCALE AND DICHOTOMOUS VARIABLE 2024 with complete solution; Liberty University Descriptive Statistics, Ordinal Scale and Dichotomous Variable 3 4.1. (a) Compute skewness for variables with five or more ordered levels 4 4.1. (b) Describe the results 4 4.1. (c) Which variables in the dataset are approximately normally distributed/scale? 5 4.1. (d) Which ones are ordered but not normal? 6 4.2. (a) Do a stem-and-leaf plot for th...
-
DA-100, DA-100, Data Analyst Exam Questions and Answers.
- Exam (elaborations) • 30 pages • 2024
-
- $24.49
- + learn more
DA-100,DA-100,Data AnalystExamQuestions and Answers. You have a large dataset that contains more than 1 million rows. The table has a datetime column named Date. You need to reduce the size of the data model. What should you do? · A. Round the hour of the Date column to startOfHour. · B. Change the data type of the Date column to Text. · C. Trim the Date column. · D. Split the Date column into two columns, one that contains only the time and another that contains only the date. - Cor...
-
Splunk Core Certified Power User Questions and Answers(A+ Solution guide)
- Exam (elaborations) • 14 pages • 2024
- Available in package deal
-
- $7.99
- + learn more
(T/F) A workflow action can be applied to both fields and event types. - True (T/F) This is a valid search: | 'monthly_sales(euro, £, 0.79)' - False (True/false) "from" command can also retrieve data from saved searches, reports or lookup files - True (True/False) A private data model can be accelerated - False (True/False) A sparkline is an inline chart, that can be added to timechart - True (True/False) Accelerated data models can be edited - False (True/false) After a field alias...
-
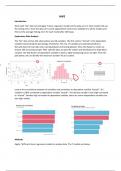
ISYE 7406 ISYE7406_HW2_2
- Other • 21 pages • 2023
-
- $9.49
- + learn more
Introduction Work with “fat” data set and apply 7 linear regression models to the data set. For each model, find out the testing error. Since the data set is small, apply Monte Carlo Cross Validation to all the models and find out the average Testing error for each model after 100 loops. Exploratory Data Analysis The “fat” data set has 252 observations and 18 variables. The first column “brozek” is the dependent variable representing the percentage of body fat. The rest 17 vari...
-
PL-300 PowerBI Exam Questions and answers already graded A+ 2024
- Exam (elaborations) • 33 pages • 2024
-
- $15.99
- + learn more
D (Visual2 and Visual5) You plan to embed multiple visualization in a public website. Your Power BI infrastructure contains the visualizations configured as shown. Visual1; characteristic: Uses row-level securitv (RLS) Visual2; characteristic: Uses a dataset that is stored in Microsoft OneDrive for Business Visual3; characteristic: Contained in a report that was shared to your user account Visual4; characteristic: Is a custom visual Visual5; characteristic: Uses a dataset from an on-premis...
-
ISYE7406_HW2_2 QUESTIONS AND ANSWERS
- Exam (elaborations) • 21 pages • 2023
- Available in package deal
-
- $9.49
- + learn more
HW2 Introduction Work with “fat” data set and apply 7 linear regression models to the data set. For each model, find out the testing error. Since the data set is small, apply Monte Carlo Cross Validation to all the models and find out the average Testing error for each model after 100 loops. Exploratory Data Analysis The “fat” data set has 252 observations and 18 variables. The first column “brozek” is the dependent variable representing the percentage of body fat. The rest 17...

-
DA-100, DA-100, Data analyst Expert SOLVED CORRECTLY QUESTIONS 2024 GRADE A+ ASSURED
- Exam (elaborations) • 28 pages • 2024
-
Available in package deal
-
- $12.49
- + learn more
DA-100, DA-100, Data analyst Expert SOLVED CORRECTLY QUESTIONS 2024 GRADE A+ ASSURED Split the Date column into two columns, one that contains only the time and another that contains only the date. - ANSWER You have a large dataset that contains more than 1 million rows. The table has a datetime column named Date. You need to reduce the size of the data model. What should you do? · A. Round the hour of the Date column to startOfHour. · B. Change the data type of the Date column to T...
-
LIFSCI 7B XL - Working with Data Questions and Answers Graded A+
- Exam (elaborations) • 7 pages • 2024
-
Available in package deal
-
- $9.99
- + learn more
LIFSCI 7B XL - Working with Data Questions and Answers Graded A+ What is the first step when analyzing a new dataset? The initial step is to explore and clean the data, ensuring accuracy by identifying and handling missing or incorrect values. How does data normalization improve the quality of analysis? It scales different data features to a common range, making comparisons more meaningful and reducing the impact of extreme values. Why is it important to understand the distributi...
-
SFU GEOG 100 Exam Review Questions and answers, rated A+
- Exam (elaborations) • 22 pages • 2024
-
- $10.49
- + learn more
SFU GEOG 100 Exam Review Questions and answers, rated A+ Urban polarization - -Skewed income distribution with growth at high and low ends Income inequality - -Unequal distribution of income in a country Psycho-social effects - -Feelings of inferiority and superiority due to inequality Stress - -Destructive impact on body and psyche Gini coefficient - -Statistical measure of income variation within a dataset Labour markets - -Markets for employment and wages Deindustrialization - -Loss ...
-
Microsoft Power BI 70-778 Certification Exam questions fully solved & updated 2024
- Exam (elaborations) • 23 pages • 2024
-
- $14.49
- + learn more
You have a Power BI model for sales data. You need to create a measure to calculate the year-to-date sales and to compare those sales to the previous year for the same time period. Which DAX function should you use? a) PARALELLPERIOD b) SAMEPERIODLASTYEAR c) DATESYTD d) PREVIOUSYEAR c) DATESYTD You have a Power BI report that displays a bar chart and a donut chart on the same page. The bar chart shows the total sales by year and the donut chart shows the total sale by category. You ...

Do you wonder why so many students wear nice clothes, have money to spare and enjoy tons of free time? Well, they sell on Stuvia! Imagine your study notes being downloaded a dozen times for $15 each. Every. Single. Day. Discover all about earning on Stuvia


