Scatter plot - Study guides, Class notes & Summaries
Looking for the best study guides, study notes and summaries about Scatter plot? On this page you'll find 1051 study documents about Scatter plot.
Page 4 out of 1.051 results
Sort by
-
BIDA 630 Data Analytics TEST (Graded A+ actual test)
- Exam (elaborations) • 11 pages • 2024
-
- $8.49
- + learn more
_____________ of data is used to assess the performance of each supervised learning model so that we can compare models and pick the best one. - The test partition - The validation partition - ️️Validation The validation partition is used to assess the performance of each supervised learning model so that we can compare models and pick the best one. In some algorithms (e.g., classification and regression trees, k-nearest neighbors) the validation partition may be used in automated fas...
-
WGU C720 OA- Operations and Supply Chain Management Complete Guide with Vocabularies| 2023/ 2024 Newly Updated!!!
- Exam (elaborations) • 54 pages • 2023
-
Available in package deal
-
- $11.49
- + learn more
WGU C720 OA- Operations and Supply Chain Management Complete Guide with Vocabularies| 2023/ 2024 Newly Updated!!! QUESTION Documentation Answer: The act of putting a procedure into writing. QUESTION ISO 9000 Answer: 2000: An international quality standard. QUESTION Plan-Do-Check-Act Cycle/Deming Wheel/Shewhart Cycle Answer: A cycle of continuous improvement that is repeated indefinitely. Planning involves using appropriate tools to identify problem...
-
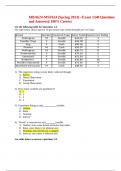
MBA624-MSF624 (Spring 2024) –Exam 1/(40 Questions and Answers)/ 100% Correct
- Exam (elaborations) • 11 pages • 2024
-
- $15.49
- + learn more
MBA624-MSF624 (Spring 2024) –Exam 1/(40 Questions and Answers)/ 100% Correct MBA624-MSF624 (Spring 2024) –Exam 1/(40 Questions and Answers)/ 100% Correct Use the following table for Questions 1-4. The table below shows data for 10 pet owners who visited EmergiCare Vet Clinic. 1) The experience rating is most likely collected through: A. Survey B. Direct Observation C. Experiment D. Group Observation 2) How many variables are quantitative? A. 1 B. 2 C. 3 D. 4 3) Expe...
-
Macroeconomics ECN211 | Questions and Correct Answers | Latest Update 2024/2025
- Exam (elaborations) • 26 pages • 2024
- Available in package deal
-
- $11.99
- + learn more
Macroeconomics ECN211 | Questions and Correct Answers | Latest Update 2024/2025 Normative statement - Answer -Statement which describes the world as it should be. It is an expression of judgment and not verifiable. Positive statement - Answer -Statement which describes the world as it is. It is verifiable. Scatter plot - Answer -Type of plot or mathematical diagram using Cartesian coordinates to display values for typically two variables for a set of data. Slope - Answer -The ratio of...
-
Pharmaceutical Chemistry Question and 100% Correct Answers| Latest Version
- Exam (elaborations) • 6 pages • 2023
-
Available in package deal
-
- $21.99
- + learn more
You are given the following data set for the activity of N, N-dimethyl-α-bromophenethylamine derivatives as adrenergic antagonists against norepinephrine (see the data for epinephrine in this module as a guide) You are tasked to calculate the log- values as well as the actual inhibitory concentrations for both the observed and calculated values based on the following Hansch equation: log= = 1.2631 - 1.6200 + 7.845 (n=22, r=0.911, s=0.257) Data entry data entry You are tasked to calculate th...
-
Statistics Exam Study Questions and Answers 100% Verified Graded A 2024
- Exam (elaborations) • 11 pages • 2024
-
- $12.49
- + learn more
Positive correlation - As one variable increases, the other variable increases Negative correlation - As one variable increases, the other decreases A point on the scatter plot represents how many values? - 2 (X and Y) Relationship between linear and scatter plot diagrams? - The regression line is the best-fitting line through a scatter plot If you see the notation (E X)(E Y) what should you do? - First sum the Xs, then sum the Ys, then multiply the sums If you see the notation E ...
-
College Algebra UPDATED Test Questions And Correct Answers
- Exam (elaborations) • 112 pages • 2024
-
- $8.99
- + learn more
Compound Inequality A pair of inequalities combined by the words and or or Correlation Coefficient A number represented by the variable r, where -1≤r≤1, that describes how closely points in a scatter plot cluster around the least-squares line Direct Variation The equation y=kx describes a direct variation, where y varies directly as x, k is the constant of variation, and k≠0 Literal Equation An equation that contains two or more variables Simplified Expression/Function An expressio...
-
QlikSense Data Architect questions and answers all are correct graded A+
- Exam (elaborations) • 6 pages • 2024
-
- $7.99
- + learn more
Slowly Changing Dimensions - Data that changes slowly but unpredictably Solution: Interval match function Line Chart - Display trends of a given measure or measures over time. KPI - Display one or two aggregated measure values. Text & image - Display text, images, links, and measures. Distribution Plot - Compare the overall range and distribution of individual values in a measure field. Gauge - Display an indicator representing the position of a measure along a range. Histogram - Evaluat...
-
MSIS 3223- Exam 1 Appendix A1, Ch. 1-4 Questions With 100 % Correct Answers | latest
- Exam (elaborations) • 11 pages • 2024
- Available in package deal
-
- $7.99
- + learn more
_____ charts provide a useful means for displaying data over time. - Line _____ charts show multiple metrics on a spider web, thus allowing plotting of multiple dimensions of several data series. This is a useful chart to compare performance of different entities such as factories, companies, and so on using the same criteria. - Radar _____ describes the lack of symmetry of data. - Skewness _____ functions depend on whether one or more conditions are true or false. - Logical _____ in formu...
-
LSSGB - Analyze Phase Test (Grade: 92%) 100% Correct
- Exam (elaborations) • 5 pages • 2024
- Available in package deal
-
- $9.99
- + learn more
LSSGB - Analyze Phase Test (Grade: 92%) 100% Correct While conducting a Value-Added Flow Analysis, the team discovered that two different departments were conducting an inspection of the same unit. Which of the following represents the most appropriate label for this step? A Non-Value-Added Step A mortgage process improvement team suspects that home loans over $500,000 take longer than less expensive loans. Which of the following could help them verify this as a root cause of length...

$6.50 for your textbook summary multiplied by 100 fellow students... Do the math: that's a lot of money! Don't be a thief of your own wallet and start uploading yours now. Discover all about earning on Stuvia


