Math 534 week 1 Study guides, Class notes & Summaries
Looking for the best study guides, study notes and summaries about Math 534 week 1? On this page you'll find 57 study documents about Math 534 week 1.
Page 4 out of 57 results
Sort by

-
MATH 534 APPLIED MANAGERIAL STATISTICS Week 7 Course Project Part C: Regression and Correlation Analysis.
- Exam (elaborations) • 10 pages • 2022
- $10.49
- + learn more
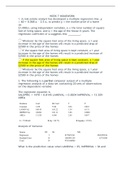
MATH 534 APPLIED MANAGERIAL STATISTICS Week 7 Course Project Part C: Regression and Correlation Analysis. COURSE PROJECT: PART C 2 1. Generate a scatterplot for the specified dependent variable (Y) and the X1 independent variable, including the graph of the "best fit" line. Interpret. Fitted Plot Line 0 20 40 60 80 100 120 140 0 10 20 30 40 50 60 According to the Graph the linear relationship there is a positive relationship between Sales and calls. If number of calls increases...
-
MATH 534 APPLIED MANAGERIAL STATISTICS Week 7 Course Project Part C Regression and Correlation Analysis.
- Exam (elaborations) • 10 pages • 2022
- $8.99
- + learn more
MATH 534 APPLIED MANAGERIAL STATISTICS Week 7 Course Project Part C Regression and Correlation Analysis. 1. Generate a scatterplot for the specified dependent variable (Y) and the X1 independent variable, including the graph of the "best fit" line. Interpret. Fitted Plot Line 0 20 40 60 80 100 120 140 0 10 20 30 40 50 60 According to the Graph the linear relationship there is a positive relationship between Sales and calls. If number of calls increases the sales also increase and...

-
MATH 534 APPLIED MANAGERIAL STATISTICS Week 7 Course Project Part C: Regression and Correlation Analysis.
- Exam (elaborations) • 10 pages • 2022
- $10.49
- + learn more
MATH 534 APPLIED MANAGERIAL STATISTICS Week 7 Course Project Part C: Regression and Correlation Analysis. 1. Generate a scatterplot for the specified dependent variable (Y) and the X1 independent variable, including the graph of the "best fit" line. Interpret. Fitted Plot Line 0 20 40 60 80 100 120 140 0 10 20 30 40 50 60 According to the Graph the linear relationship there is a positive relationship between Sales and calls. If number of calls increases the sales also increase an...
-
MATH 534 Week 2 Addendum; Homework-Quiz Review
- Exam (elaborations) • 4 pages • 2023
- $9.39
- + learn more
MATH 534 Week 2 Addendum; Homework-Quiz Review
-
MATH 534 Applied Managerial Statistics (Updated 2023) Week 4 Addendum: Homework NEW GUARANTEED PASS
- Exam (elaborations) • 6 pages • 2023
- $14.00
- + learn more
MATH 534 Applied Managerial Statistics (Updated 2023) Week 4 Addendum: Homework NEW GUARANTEED PASS

As you read this, a fellow student has made another $4.70

-
MATH 534 Week 2 Addendum Homework Quiz Review Updated 2023 Version Accurate
- Exam (elaborations) • 4 pages • 2023
- $11.48
- + learn more
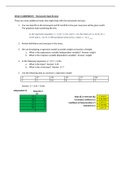
MATH 534 Week 2 Addendum Homework Quiz Review Updated 2023 Version Accurate True/False. 2.13 in valid probability. Question: True/False. The union of two events is the probability of both events occurring Question: Determine if each variable below is discrete or continuous:
-
MATH 534 Addendum; Homework-Quiz Week 1, 2, 4, 6 (Package Deal)
- Package deal • 4 items • 2023
- $50.48
- + learn more
MATH 534 Addendum; Homework-Quiz Week 1, 2, 4, 6 (Package Deal)
-
MATH 534 Week 7 Course Project Part C: Regression and Correlation Analysis LATEST MAY 26TH 2021 EXAM PERIOD WITH GUARANTEED GRADE A+
- Other • 9 pages • 2021
- $17.99
- + learn more
MATH 534 Week 7 Course Project Part C: Regression and Correlation Analysis LATEST MAY 26TH 2021 EXAM PERIOD WITH GUARANTEED GRADE A+ Introduction and Overview In Statistics, an Exploratory Data Analysis is considered as an approach for data analysis that requires a variety of techniques on how an analysis should be carried out (What Is Exploratory Data Analysis?). It is usually the first step in the data analysis project. In this paper, we shall analyze a given set of variables by using g...
-
MATH 534 Week 1 Addendum; Homework-Quiz, Discussion, Homework Problems, Quiz (Package Deal)
- Package deal • 5 items • 2023
- $60.48
- + learn more
MATH 534 Week 1 Addendum; Homework-Quiz, Discussion, Homework Problems, Quiz (Package Deal)
-
MATH 534 Homework Problems Week 1 - 7 (Package Deal)
- Package deal • 9 items • 2023
- $100.48
- + learn more
MATH 534 Homework Problems Week 1 - 7 (Package Deal)
