Logistic regression test - Study guides, Class notes & Summaries
Looking for the best study guides, study notes and summaries about Logistic regression test? On this page you'll find 258 study documents about Logistic regression test.
Page 4 out of 258 results
Sort by
-
ISYE 6414 Final Exam Questions and Answers Already Graded A
- Exam (elaborations) • 6 pages • 2023
- $9.99
- + learn more
ISYE 6414 Final Exam Questions and Answers Already Graded A 1. If there are variables that need to be used to control the bias selection in the model, they should forced to be in the model and not being part of the variable selection process. True 2. Penalization in linear regression models means penalizing for complex models, that is, models with a large number of predictors. True 3. Elastic net regression uses both penalties of the ridge and lasso regression and hence combines the benefits ...
-
CompTIA DataX Study Guide: Exam DY0-001 (Sybex Study Guide) 1st Edition 2024 with complete solution
- Exam (elaborations) • 590 pages • 2024
- $20.49
- + learn more
CompTIA DataX Study Guide: Exam DY0-001 (Sybex Study Guide) 1st Edition 2024 with complete solution In CompTIA DataX Study Guide: Exam DY0-001, data scientist and analytics professor, Fred Nwanganga, delivers a practical, hands-on guide to establishing your credentials as a data science practitioner and succeeding on the CompTIA DataX certification exam. In this book, you'll explore all the domains covered by the new credential, which include key concepts in mathematics and statistics; techn...
-
ISYE6414 (Regression) Midterm 2 Real Exam Questions With All Complete Answers.
- Exam (elaborations) • 17 pages • 2024
- $13.49
- + learn more
What is cooks distance used for? - correct answer It measures how much all of the values in the regression model change with the ith observation is removed. Basically its a test for outliers Rule of thumb: D denotes cooks distance, if D is > 4/n OR D > 1 or any large D then it may be an outlier and should be removed. If the normality assumption does not hold, we can pursue a transformation in the response variable. T/F - correct answer ...
-
ISYE 6414 Final Exam (2023) with Complete Solutions Graded A
- Exam (elaborations) • 7 pages • 2023
- $11.49
- + learn more
True - The relationship that links the predictors is highly non-linear. - In Logistic Regression, the relationship between the probability of success and the predicting variables is non-linear. False - In logistic regression, there are no error terms. - In Logistic Regression, the error terms follow a normal distribution. True - the logit function is also known as the log-odds function, which is the ln(P/1-p). - The logit function is the log of the ratio of the probability of success to th...
-
BCPS Exam | questions and answers 2023/24
- Exam (elaborations) • 56 pages • 2023
- $9.99
- + learn more
BCPS Exam | questions and answers 2023/24 Unpaired T-test - Continuous data 2 independent samples Paired T-test - Continuous data 2 paired samples ANOVA - Continuous outcome data Categorical exposure data 3+ independent variables ANCOVA - Continuous outcome data Categorical exposure data 3+ independent variables Controls for covariates Wilcoxon Rank Sum Test (Mann-Whitney U Test) - Ordinal data 2 independent samples Wilcoxon Signed Rank Test - Ordinal data 2 paired sampl...

Want to regain your expenses?

-
WGU C207 Data Driven Decision Making Module 3 Exam 2024 Graded A
- Exam (elaborations) • 12 pages • 2024
- $12.49
- + learn more
The relationship between several independent variables and one dependent variable is shown using __________. a logistic regression b simple linear regression c multiple linear regression d nonlinear regression - c multiple linear regression Company A sells its 12,000th unit of the year. With that sale, the company's revenue and cost curves meet. What is this point called? a revenue point b crossover point c cost point d breakeven point - d breakeven point Cluster analysis a...
-
WGU Statistics Test 100% Solved 2024
- Exam (elaborations) • 39 pages • 2024
- $13.49
- + learn more
WGU Statistics Test 100% Solved 2024 In a standard 52-card deck, where each card is assigned a numeric value, the mean of the 52 cards is 7.0 with a standard deviation of 3.742. To test if a representative sample can be attained, the deck is shuffled and 13 cards are randomly drawn, one at a time. Each card is recorded and then returned randomly to the deck before the next card is drawn. This process of drawing 13 random cards is repeated a total of 20 times, and the mean and standard devi...
-
WGU Statistics exam 2023 with complete solution graded A+
- Exam (elaborations) • 31 pages • 2023
- $8.49
- + learn more
In a standard 52-card deck, where each card is assigned a numeric value, the mean of the 52 cards is 7.0 with a standard deviation of 3.742. To test if a representative sample can be attained, the deck is shuffled and 13 cards are randomly drawn, one at a time. Each card is recorded and then returned randomly to the deck before the next card is drawn. This process of drawing 13 random cards is repeated a total of 20 times, and the mean and standard deviation of each round is computed. Which...
-
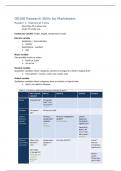
Samenvatting - OE106 Research Skills for Marketeers (OE106)
- Summary • 10 pages • 2023
- $5.14
- 1x sold
- + learn more
Cijfer: 8.0! Samenvatting OE106 Research Skills for Marketeers. Programma SPSS uitgelegd met stappen per hoofdstuk. Grade: 8.0! Summary OE106 Research Skills for Marketers. Explanation of the SPSS program with step-by-step guidance for each chapter.
