Stat 200 week 3 homework Study guides, Class notes & Summaries
Looking for the best study guides, study notes and summaries about Stat 200 week 3 homework? On this page you'll find 139 study documents about Stat 200 week 3 homework.
Page 2 out of 139 results
Sort by
-
STAT 200 Week 3 Homework Problems.
- Exam (elaborations) • 7 pages • 2022
- $10.47
- + learn more
STAT 200 Week 3 Homework Problems 4.1.4 A project conducted by the Australian Federal Office of Road Safety asked people many questions about their cars. One question was the reason that a person chooses a given car, and that data is in table #4.1.4 ("Car preferences," 2013). Table #4.1.4: Reason for Choosing a Car Safety Reliability Cost Performance Comfort Looks 84 62 46 34 47 27 Find the probability a person chooses a car for each of the given reasons. Total frequency = 84+62+46+3...
-
MATH302 WEEK 8 PRACTISE TEST
- Exam (elaborations) • 19 pages • 2022
- $10.49
- + learn more
MATH302 WEEK 8 PRACTISE TEST 2/27/2020 APUS CLE : MATH302 B007 Win 20 : Tests & Quizzes 0.0/ 1.0 Points 1.0/ 1.0 Points Week 8 Knowledge Check Homework Practice Questions Return to Assessment List Part 1 of 4 - Chi-Square Test for Homogeneity 4.0/ 8.0 Points Question 1 of 20 Click to see additional instructions A college prep school advertises that their students are more prepared to succeed in college than other schoverify this, they categorize GPA’s into 4 groups and look up the...
-
STAT 200 STAT200 WEEK 7 HOMEWORK with accurate SOLUTION (UMUC)
- Exam (elaborations) • 8 pages • 2022
- $11.00
- + learn more
STAT 200 STAT200 WEEK 7 HOMEWORK with accurate SOLUTION (UMUC) STAT 200 STAT200 WEEK 7 HOMEWORK SOLUTION (UMUC) Anquanette Sterling STAT Week 7 Homework #1) 2 Points 2. The formula for a regression equation is Y’ = 2X + 9. a. What would be the predicted score for a person scoring 6 on X? Y = 2(6) + 9 = 12+9 = 21 b. If someone’s predicted score was 14, what was this person’s score on X? 14 = 2X + 9 -9 -9 5 = 2X 2.5 = X #2) 2 Points 6. For the X,Y data below ...
-
STAT 200 Week 1 to week 7
- Package deal • 7 items • 2022
- $40.49
- + learn more
STAT 200 Week 7 Homework Problems Exam (elaborations) STAT 200 Week 5 Homework Problems Exam (elaborations) STAT 200 Week 2 Homework Problems Exam (elaborations) STAT 200 Week 4 Homework Problems Exam (elaborations) STAT 200 Week 6 Homework Problems. Exam (elaborations) STAT 200 Assignment #3: Inferential Statistics Analysis and Writeup
-
STAT 200 Week 3 Homework Problems answers 2023
- Exam (elaborations) • 6 pages • 2023
- $2.99
- + learn more
TAT 200 Week 3 Homework Problems 4.1.4 A project conducted by the Australian Federal Office of Road Safety asked people many questions about their cars. One question was the reason that a person chooses a given car, and that data is in table #4.1.4 ("Car preferences," 2013). Table #4.1.4: Reason for Choosing a Car Safety Reliability Cost Performance Comfort Looks 84 62 46 34 47 27 Find the probability a person chooses a car for each of the given reasons. Total: 84+62+46+34+47+27=3...

And that's how you make extra money

-
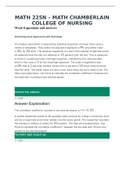
MATH 225N – MATH CHAMBERLAIN COLLEGE OF NURSING Week 8 questions and answers
- Exam (elaborations) • 54 pages • 2022
- $13.49
- + learn more
MATH 225N – MATH CHAMBERLAIN COLLEGE OF NURSING Week 8 questions and answers MATH 225N – MATH CHAMBERLAIN COLLEGE OF NURSING Week 8 questions and answers Performing Linear Regressions with Technology An amateur astronomer is researching statistical properties of known stars using a variety of databases. They collect the absolute magnitude or MV and stellar mass or M⊙ for 30 stars. The absolute magnitude of a star is the intensity of light that would be observed from the star at a...

-
Exam (elaborations) STAT 200/STAT 200 Week 3 Homework Problems.
- Exam (elaborations) • 6 pages • 2021
- $9.49
- + learn more
STAT 200 Week 3 Homework Problems 4.1.4 A project conducted by the Australian Federal Office of Road Safety asked people many questions about their cars. One question was the reason that a person chooses a given car, and that data is in table #4.1.4 ("Car preferences," 2013). Table #4.1.4: Reason for Choosing a Car Safety Reliability Cost Performance Comfort Looks 84 62 46 34 47 27 Find the probability a person chooses a car for each of the given reasons. 4.2.2 Eyeglassomatic manufactures eyeg...
-
STAT 200 Week 3 Homework Problems.LATEST UPDATE 2021
- Exam (elaborations) • 5 pages • 2021
- $8.99
- + learn more
STAT 200 Week 3 Homework Problems 4.1.4 A project conducted by the Australian Federal Office of Road Safety asked people many questions about their cars. One question was the reason that a person chooses a given car, and that data is in table #4.1.4 ("Car preferences," 2013). Table #4.1.4: Reason for Choosing a Car Safety Reliability Cost Performance Comfort Looks 84 62 46 34 47 27 Find the probability a person chooses a car for each of the given reasons. 4.2.2 Eyeglassomatic manufactures eyeg...
-
STAT 200 Week 3 Homework Problems.
- Exam (elaborations) • 6 pages • 2021
- $8.49
- + learn more
STAT 200 Week 3 Homework Problems 4.1.4 A project conducted by the Australian Federal Office of Road Safety asked people many questions about their cars. One question was the reason that a person chooses a given car, and that data is in table #4.1.4 ("Car preferences," 2013). Table #4.1.4: Reason for Choosing a Car Safety Reliability Cost Performance Comfort Looks 84 62 46 34 47 27 Find the probability a person chooses a car for each of the given reasons. 4.2.2 Eyeglassomatic manufactures eyeg...
-
STAT 200 Week 6 Homework Problems, full solution guide, 100% correct. and graded A
- Exam (elaborations) • 11 pages • 2022
- $13.49
- + learn more
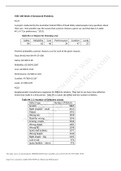
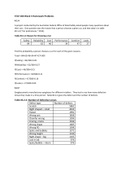
STAT 200 Week 6 Homework Problems 9.1.2 Many high school students take the AP tests in different subject areas. In 2007, of the 144,796 students who took the biology exam 84,199 of them were female. In that same year, of the 211,693 students who took the calculus AB exam 102,598 of them were female ("AP exam scores," 2013). Estimate the difference in the proportion of female students taking the biology exam and female students taking the calculus AB exam using a 90% confidence level. n1...
