Dat 565 - Study guides, Class notes & Summaries
Looking for the best study guides, study notes and summaries about Dat 565? On this page you'll find 29 study documents about Dat 565.
Page 2 out of 29 results
Sort by

-
DAT 565 WEEK 1 APPLY:STATISTICS ANALYSIS
- Exam (elaborations) • 6 pages • 2022
-
- $9.49
- + learn more
DAT 565 WEEK 1 APPLY:STATISTICS ANALYSIS Descriptive Statistics-Calculation of the standard deviation, Mean, interquartile range (IQR), skew, and 5-number summary for each of the variables. Create a histogram for the “Sales/SqFt” variable. Was the distribution symmetric? If not, what is the skew for the dataset? Were there any outliers? If so, which ones? What is the “SqFt” area of the outliers? Is the outlier(s) larger or smaller than the average restaurant in the database? Wh...
-
DAT 565 Week 2.docx DAT/565 Statistical Report DAT/565 University of Phoenix Statistical Report Scope and Descriptive Statistics The company Pastas R Us is coming up with the strategy of increasing the number of restaurants within a certain range
- Summary • 7 pages • 2021
-
- $7.49
- 5x sold
- + learn more
DAT 565 Week DAT/565 Statistical Report DAT/565 University of Phoenix Statistical Report Scope and Descriptive Statistics The company Pastas R Us is coming up with the strategy of increasing the number of restaurants within a certain range to increase customers' number. Although there are already restaurants implemented in the area, the company plans to develop new restaurants under various conditions, including education level, income per household, and the median age of the populati...
-
Apply Week 3 Market Analysis Research.docx DAT/565 Market Analysis Research University of Phoenix DAT/565 Business overview, Mission, and Vision Market analysis My businesses competition would be places like Petco and Petsmart as they are ve
- Summary • 2 pages • 2021
-
- $7.49
- 2x sold
- + learn more
Apply Week 3 Market Analysis R DAT/565 Market Analysis Research University of Phoenix DAT/565 Business overview, Mission, and Vision Market analysis My businesses competition would be places like Petco and Petsmart as they are very stiff competition in our business space. We are a business that is new to the game, but when it comes to market size in the year 2019-2020, seventy seven percent of American households, or 85 million households own at least one pet. That number has only ...
-
DAT 565 Week 5.docx DAT/565 Regression Modeling DAT/565 University of Phoenix Regression Modeling The first scatter plot will be analyzing two variables, which are Assessed Value and Floor Area. From the scatter graph above, we can see a positive
- Summary • 4 pages • 2021
-
- $7.49
- 6x sold
- + learn more
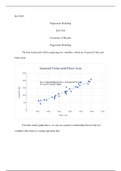
DAT 565 Week DAT/565 Regression Modeling DAT/565 University of Phoenix Regression Modeling The first scatter plot will be analyzing two variables, which are Assessed Value and Floor Area. From the scatter graph above, we can see a positive relationship between the two variables since there is a rising regression line. From the summary output above, we can conclude that the floor area is a significant predictor of Assessment value. The second graph represents a comparison of two var...
-
week 2 Apply Signature Assignment Statistical Report.docx DAT/565 Apply: Signature Assignment: Statistical Report DAT/565: Data Analysis and Business Analytics Section 1: Scope and Descriptive Statistics Pastas R Us, Inc thought of creating a loyal
- Summary • 6 pages • 2021
-
- $7.49
- 7x sold
- + learn more
week 2 Apply Signature Assignment Statistical R DAT/565 Apply: Signature Assignment: Statistical Report DAT/565: Data Analysis and Business Analytics Section 1: Scope and Descriptive Statistics Pastas R Us, Inc thought of creating a loyalty card to incentivize customers to return more often to their establishments. Their marketing plan aimed at rolling out a loyalty card strategy to increase sales. "Under this program, customers present their loyalty card when paying for their orders and...
-
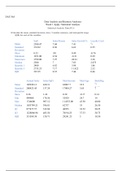
DAT565 Week 1 Apply.docx DAT/565 Data Analysis and Business Analytics Week 1 Apply: Statistical Analysis Statistical Analysis: Pasta R Us ï‚·Calculate the mean, standard deviation, skew, 5-number summary, and interquartile range (IQR) for each of
- Summary • 3 pages • 2021
-
- $7.49
- 11x sold
- + learn more
DAT565 Week 1 A DAT/565 Data Analysis and Business Analytics Week 1 Apply: Statistical Analysis Statistical Analysis: Pasta R Us ï‚·Calculate the mean, standard deviation, skew, 5-number summary, and interquartile range (IQR) for each of the variables. Mean SqFt 2580.47 Sales/Person 7.04 Sales Growth % 7.41 Loyalty Card % 2.03 Standard Deviation 374.92 0.3
-
DAT 565 - Week 4 Exercise. Questions and Answers. Complete Solutions.
- Exam (elaborations) • 29 pages • 2021
-
- $15.49
- + learn more
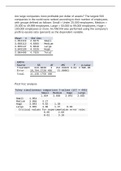
DAT 565 - Week 4 Exercise. Questions and Answers. Complete Solutions. Are large companies more profitable per dollar of assets? The largest 500 companies in the world were ranked according to their number of employees, with groups defined as follows: Small = Under 25,000 employees, Medium = 25,000 to 49,999 employees, Large = 50,000 to 99,000 employees, Huge = 100,000 employees or more. An ANOVA was performed using the company’s profit-to-assets ratio (percent) as the dependent variabl...
-
Week2 Statistical Report.docx DAT/565 Signature Assignment: Statistical Report DAT/565 Signature Assignment: Statistical Report A business needs to understand and apply statistical methods when analyzing operational data, evaluating the performance
- Summary • 3 pages • 2021
-
- $7.49
- 2x sold
- + learn more
Week2 Statistical R DAT/565 Signature Assignment: Statistical Report DAT/565 Signature Assignment: Statistical Report A business needs to understand and apply statistical methods when analyzing operational data, evaluating the performance of current marketing strategies, and recommending actionable business decisions to discover where the business performance is exceeding and where it is falling short. When a business wants to expand, it can use statistical methods to decide what the best...
-
week 1 Apply Statistics Analysis.docx Apply: Statistics Analysis 1 Apply: Statistics Analysis DAT/565: Data Analysis and Business Analytics
- Summary • 4 pages • 2021
-
- $7.49
- 3x sold
- + learn more
week 1 Apply Statistics A Apply: Statistics Analysis 1 Apply: Statistics Analysis DAT/565: Data Analysis and Business Analytics Insert a new column in the database that corresponds to €œAnnual Sales.€ Annual Sales is the result of multiplying a restaurants €œSqFt.€ by €œSales/SqFt.€ o 2354 x 701.97 = 1,652,437.40 (SqFt x Sales/SqFt = Annual Sales) See Figure...
DAT 565 Week 4 Signature Assignment:Globalization and Information Research

Did you know that on average a seller on Stuvia earns $82 per month selling study resources? Hmm, hint, hint. Discover all about earning on Stuvia


