STAT 200: Introduction To Statistics (STAT 200)
University Of Maryland - College Park
All 3 results
Sort by

-
STAT 200 Week 3 Homework Problems - STAT200 Week 3: Introduction To Statistics Quiz
- Exam (elaborations) • 5 pages • 2021
-
- $15.50
- + learn more
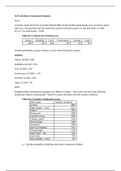
STAT 200 Week 3 Homework Problems 4.1.4 A project conducted by the Australian Federal Office of Road Safety asked people many questions about their cars. One question was the reason that a person chooses a given car, and that data is in table #4.1.4 ("Car preferences," 2013). Table #4.1.4: Reason for Choosing a Car Safety Reliability Cost Performance Comfort Looks 84 62 46 34 47 27 Find the probability a person chooses a car for each of the given reasons. Solution: Safety: 84/300 ...

-
STAT 200 Week 7 Homework Problems - STAT200 Week 7: Introduction To Statistics Quiz
- Exam (elaborations) • 9 pages • 2021
-
- $15.40
- + learn more
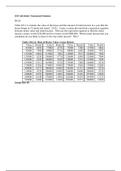
STAT 200 Week 7 Homework Problems 10.1.2 Table #10.1.6 contains the value of the house and the amount of rental income in a year that the house brings in ("Capital and rental," 2013). Create a scatter plot and find a regression equation between house value and rental income. Then use the regression equation to find the rental income a house worth $230,000 and for a house worth $400,000. Which rental income that you calculated do you think is closer to the true rental income? Why? Table ...

-
STAT 200 Week 4 Homework Problems - STAT200 Week 4: Introduction To Statistics Quiz
- Exam (elaborations) • 5 pages • 2021
-
- $15.20
- + learn more
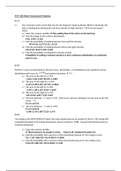
STAT 200 Week 4 Homework Problems 6.1.2 ⦁ The commuter trains on the Red Line for the Regional Transit Authority (RTA) in Cleveland, OH, have a waiting time during peak rush hour periods of eight minutes ("2012 annual report," 2012). ⦁ State the random variable. X=The waiting time of the trains on the Red Line ⦁ Find the height of this uniform distribution. F(x)= 1/8-0 = 0.125 ⦁ Find the probability of waiting between four and five minutes. P(4<X<5)= (5-4)*0.125 = 0.125...

Do you wonder why so many students wear nice clothes, have money to spare and enjoy tons of free time? Well, they sell on Stuvia! Imagine your study notes being downloaded a dozen times for $15 each. Every. Single. Day. Discover all about earning on Stuvia


