Statistics (MATH 225N)
Chamberlain College Of Nursng
All 5 results
Sort by
-
MATH 225N WEEK 6 STATISTICS QUIZ WITH ANSWERS UPDATED 2023
- Exam (elaborations) • 11 pages • 2023
-
- $16.49
- + learn more
MATH 225N WEEK 6 STATISTICS QUIZ WITH ANSWERS UPDATED 2023 Question 1 A statistics professor recently graded final exams for students in her introductory statistics course. In a review of her grading, she found the mean score out of 100 points was a x¯=77, with a margin of error of 10. Construct a confidence interval for the mean score (out of 100 points) on the final exam
-
Math 225N Week 8 COMPLETE STATISTICS BUNDLE 2020 _ Graded A
- Package deal • 6 items • 2021
-
- $32.99
- + learn more
Math 225N Week 8 Questions and Answers 2020 – Graded A MATH 225N WEEK 8 FINAL EXAM 2020 – CHAMBERLAIN COLLEGE OF NURSING (A GRADE) MATH 225N Week 8 Stats Assignment Coefficient of Determination_2020 Math 225N Week 8 StMATH 225N WEEK 8 FINAL EXAM {2020}_50 Questions statistics _ Module Correlation 2020 MATH 225N Week 8 Assignment_Predictions Using L
-
MATH 225N Week 8 Stats Assignment Coefficient of Determination_2020 | MATH225N Week 8 Stats Assignment_Graded A
- Exam (elaborations) • 4 pages • 2021
- Available in package deal
-
- $8.99
- + learn more
MATH 225N Week 8 Stats Assignment Coefficiet of Determination – Chamberlain College of Nursing Compute and interpret the coefficient of determination Question A medical experiment on tumor growth gives the following data table. x y 57 38 61 50 63 76 68 97 72 113 The least squares regression line was found. Using technology, it was determined that the total sum of squares (SST) was 3922.8 and the sum of squares of regression (SSR) was 3789.0. Calculate R2, rounded to three decimal ...
-
MATH 225N Statistics Correlation and Y-intercepts Quiz 2020 | MATH225N Stat correlation and Y-intercepts Quiz_A Grade
- Exam (elaborations) • 16 pages • 2021
-
- $12.49
- + learn more
MATH 225N Stat correlation and Y-intercepts Quiz 2020 – Chamberlain College of Nursing Question A plot of time versus the price of a best-selling model of television has horizontal units of years since 2000 and vertical units of dollars. The best fit line of the data are defined by the equation y=−75x+550, where x=year and y=price. What are the units of the slope? Perfect. Your hard work is paying off
-
MATH 225N STATISTICS FINAL EXAM (2020) – Graded A | MATH225N STATISTICS FINAL EXAM (2020) – School Graded
- Exam (elaborations) • 71 pages • 2021
-
- $15.99
- + learn more
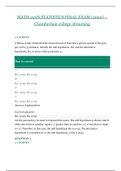
MATH 225N STATISTICS FINAL EXAM (2020) – Chamberlain college of nursing 1/1 POINTS A fitness center claims that the mean amount of time that a person spends at the gym per visit is 33 minutes. Identify the null hypothesis, H0, and the alternative hypothesis, Ha, in terms of the parameter μ. That is correct! H0: μ≠33; Ha: μ=33 H0: μ=33; Ha: μ≠33 H0: μ≥33; Ha: μ<33 H0: μ≤33; Ha: μ>33 Answer Explanation Correct answer: H0: μ=33; Ha: μ≠33 Let the parameter ...

$6.50 for your textbook summary multiplied by 100 fellow students... Do the math: that's a lot of money! Don't be a thief of your own wallet and start uploading yours now. Discover all about earning on Stuvia


