University of Connecticut
Latest uploads at University of Connecticut. Looking for notes at University of Connecticut? We have lots of notes, study guides and study notes available for your school.
-
251
- 0
-
14
All courses for University of Connecticut
Latest notes & summaries University of Connecticut
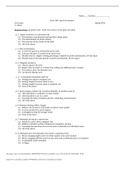
Multiple choice (4 points each). Write your answer in the space provided. _d_1. Sports economics is concerned with (a) The business of professional and big-time college sports (b) The determination of player salaries (c) The structure of the contest on the field (d) All of the above _c_2. Win maximization (a) Is never the goal of a professional sports team (b) Is always the goal of a professional sports team (c) Should result in a higher winning percentage compared to profit maximization,...
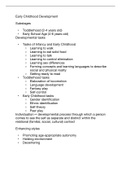
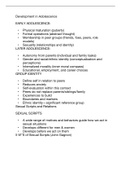
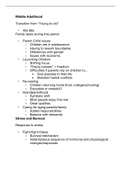
Notes taken from in-person lectures on chapters and modules.
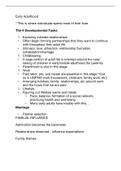
In-person lecture notes taken on chapter/module 9 for HDFS 1070.
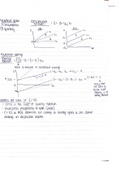
addressing the most important variable in the consumption spending equation, illustrating on graph and preforming multiple equations out step by step.
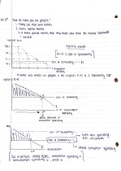
how firms determine when to dive into projects, with illustrated graphs and filing an equation based off looking at an illustration. determining new variables and their meanings as well as affecting the consumption graphs.
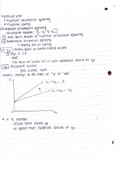
diving deep into saving vs spending and what that represents in the business world. following equations, evaluating every variable needed and breaking down what contributes to investment spending, how its relevant and putting it in real life scenarios
we take a deeper look within the household sector and evaluate what goes into consumption spending. we illustrate many kinds of graphs representing many scenarios that tend to frequently play out. what happens if and when x and y take place and why. Looking at different equations and filling them out step by step
after understanding nominal and real gdp we begin to take a look at interest rates and how it affects aggregate demand. we dive deeper into the household sector and illustrating a graph on what it looks like when interest rates fluctuate.

