This document contains detailed step-by-step instructions for programming with RStudio based on the Advanced Data Analysis course ready to be used during the practical exam. It includes the answers to all questions that appear on practical documents posted during the course as well as class notes, ...
CRM Advanced data analysis: Exam preparation Mar’2024
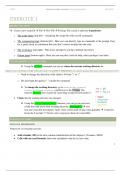
EXERCICE 1
BEFORE YOU START
Create a new script file File New File R Script. The screen is split into 4 quadrants:
o The script editor (top left) : visualizing the script file with your R-commands.
o The command prompt (bottom left) : Here you can directly type in commands at the prompt. Easy
for a quick check or calculation that you don’t want to include into the code.
o The workspace (top right) : This stores all objects you have defined (see later).
o Output panel (bottom right) : Here you can see plots, look for help, select packages (see later)
TELLING WHERE IS THE DIRECTORY
Using the setwd() command you can see where the current working directory is:
o Need to change the direction of the slashes from "\" to "/"
o Do not forget the quotes (" ") inside the command
To change the working directory, go to Session/Set working
directory/Choose directory and browse to the C:\temp. The
function setwd() does exactly the same thing (using forward slashes!):
Check that the working directory has changed.
Using the list.files(getwd())function, you can get an overview
of the files that are in your working directory. Set or get??? així
tens una vista dels documents, I pots veure el nom amb els que estan guradats t’estalvies
haver-ho d’escriure !!! fer-ho com a segon pas abans de (read.table)
READING IN A TABLE
EXCEL FILE PREPARATI ON
Prepare the excel making sure that:
Add a header (ID) in the first column (identification of the subjects) header =TRUE
Cells with an excel formula: better the calculated value by its real value.
1
,CRM Advanced data analysis: Exam preparation Mar’2024
We need (.) instead of comas (,) need to be specified already by default.
Delete brackets
Avoid white spaces (in this case on the names), delete it instead sep
Missing value indicator (?) need to be specified na.strings = "?"
ID-variable has been interpreted as a factor with 12 levels. Hence, internally the ID will be considered as a
number. We’d rather have it as a character vector myData$ID <- as.character(myData$ID)
to make sure it has changed:
class(myData$ID)
str(myData)
º X
To create a tab-delimited (.txt) file, go to File\ save as\ Save as type text (Tab
delimited)(.txt).
You get a warning that the document may contain features not compatible with the .txt
format, and that you are only saving the active sheet. Click OK/yes. Quit the excel
workbook without further saving (you already did save your workbook before).
check if the .txt document has been created.
The R-function to read in the table is read.table().At the command prompt (bottom left
panel)
File (mandatory, the name) within quotes.First argument is the name of the file: (data(1).txt in this
case).
header: first column names: header=TRUE
stringsAsFactors: indication that there are text strings that need to be read in as factors.
StringAsFactors=TRUE
sep: indication that there as white spaces. In case you get the warning “More columns than column
names” sep=”\t”
Indicates that there is a missing value, that need to be considered (by default is “na” na.strings
= "?"
2
,CRM Advanced data analysis: Exam preparation Mar’2024
We need (.) instead of comas (,) need to be specified dec = "."
Ask for help on the by typing ?read.table.
SAVING AN OBJECT
Using the assignment operator (<-), you have given a name to the data you’ve read in. This object
is called “myData” appear in the top right panel of R Studio.
o myData <- read.table(file="data1.txt",sep="\t",header=T)
If you want to see your saved object: Type the word “myData” at the prompt (bottom left panel in
RStudio). Remember, R is case sensitive!! “myData” is not the same as “MYDATA” or “mydata”!!
CALCULATIONS
Object: myX<- seq(from=-3,to=3,by=0.5) vector
From (start)
To (final)
By (increment) how large the steps are.
mean(myX) calculate the mean
sum(myX) calculate the summation
A vector is the elementary structure for data handling in R. It is a set of
simple elements, all being objects of the same class. For example, a
simple vector of the numbers one to three can be constructed by one of
the following commands:
DATA STRUCTURE
What kind of data structure would it be? Use the class function. class(myData)
The variables in the data frame myData are of different data types:
o factor (=categorical variable with limited number of levels, ordered of not.
o num(eric) and int(eger) both of which represent numeric variables.
3
, CRM Advanced data analysis: Exam preparation
Mar’2024
o character (=text string)
o logical (TRUE or FALSE).
The gender of the persons in our dataset are stored as a factor class
(myData$gender)
The levels of the factor can be extracted using the levels function levels(myData$gender)
A more comprehensive overview of the current data structure str(myData)
The output tells you again that ‘myData’ is an object of class data frame, how many
observations and variables, and what type of data the different variables represent.
In R, the names of the variables are an entire part of the data frame names(myData)
The individual variables are also objects, and belong to a class
class(myData$exam)
4
Les avantages d'acheter des résumés chez Stuvia:
Qualité garantie par les avis des clients
Les clients de Stuvia ont évalués plus de 700 000 résumés. C'est comme ça que vous savez que vous achetez les meilleurs documents.
L’achat facile et rapide
Vous pouvez payer rapidement avec iDeal, carte de crédit ou Stuvia-crédit pour les résumés. Il n'y a pas d'adhésion nécessaire.
Focus sur l’essentiel
Vos camarades écrivent eux-mêmes les notes d’étude, c’est pourquoi les documents sont toujours fiables et à jour. Cela garantit que vous arrivez rapidement au coeur du matériel.
Foire aux questions
Qu'est-ce que j'obtiens en achetant ce document ?
Vous obtenez un PDF, disponible immédiatement après votre achat. Le document acheté est accessible à tout moment, n'importe où et indéfiniment via votre profil.
Garantie de remboursement : comment ça marche ?
Notre garantie de satisfaction garantit que vous trouverez toujours un document d'étude qui vous convient. Vous remplissez un formulaire et notre équipe du service client s'occupe du reste.
Auprès de qui est-ce que j'achète ce résumé ?
Stuvia est une place de marché. Alors, vous n'achetez donc pas ce document chez nous, mais auprès du vendeur clararubio. Stuvia facilite les paiements au vendeur.
Est-ce que j'aurai un abonnement?
Non, vous n'achetez ce résumé que pour €13,46. Vous n'êtes lié à rien après votre achat.