COMPLETE SOLUTION MANUAL FOR
Managerial Economics and Business Strategy 10th Edition
By Michael Baye, Jeff Prince
Chapter 1
The Fundamentals of Managerial Economics
Answers to Questions and Problems
1. This situation best represents producer-producer rivalry. Here, Southwest is a
producer attempting to steal customers away from other producers in the form of
lower prices.
2. The maximum you would be willing to pay for this asset is the present value, which is
3.
a. Net benefits are N(Q) = 20 + 24Q – 4Q2.
b. Net benefits when Q = 1 are N(1) = 20 + 24 – 4 = 40 and when Q = 5 they are
N(5) = 20 + 24(5) – 4(5)2 = 40.
c. Marginal net benefits are MNB(Q) = 24 – 8Q.
d. Marginal net benefits when Q 1 are MNB(1) = 24 – 8(1) = 16 and when Q 5
they are MNB(5) = 24 – 8(5) = -16.
e. Setting MNB(Q) = 24 – 8Q = 0 and solving for Q, we see that net benefits are
maximized when Q = 3.
f. When net benefits are maximized at Q = 3, marginal net benefits are zero. That is,
MNB(3) = 24 – 8(3) = 0.
4.
a. The value of the firm before it pays out current dividends is
( )
.
b. The value of the firm immediately after paying the dividend is
Managerial Economics and Business Strategy, 10e Page 1
Copyright © 2022 by McGraw-Hill Education.
All rights reserved. No reproduction or distribution without the prior written consent of McGraw-Hill Education.
, ( )
.
5. The present value of the perpetual stream of cash flows. This is given by
6. The completed table looks like this:
Marginal
Control Total Total Net Marginal Marginal
Net
Variable Benefits Cost Benefits Benefit Cost
Benefit
Q B(Q) C(Q) N(Q) MB(Q) MC(Q)
MNB(Q)
100 1200 950 250 210 60 150
101 1400 1020 380 200 70 130
102 1590 1100 490 190 80 110
103 1770 1190 580 180 90 90
104 1940 1290 650 170 100 70
105 2100 1400 700 160 110 50
106 2250 1520 730 150 120 30
107 2390 1650 740 140 130 10
108 2520 1790 730 130 140 -10
109 2640 1940 700 120 150 -30
110 2750 2100 650 110 160 -50
a. Net benefits are maximized at Q = 107.
b. Marginal cost is slightly smaller than marginal benefit (MC = 130 and MB = 140).
This is due to the discrete nature of the control variable.
7.
a. The net present value of attending school is the present value of the benefits
derived from attending school (including the stream of higher earnings and the
value to you of the work environment and prestige that your education provides),
minus the opportunity cost of attending school. As noted in the text, the
opportunity cost of attending school is generally greater than the cost of books
and tuition. It is rational for an individual to enroll in graduate school when his or
her net present value is greater than zero.
b. Since this decreases the opportunity cost of getting an M.B.A., one would expect
more students to apply for admission into M.B.A. Programs.
8.
Page 2 Michael R. Baye & Jeffrey T. Prince
Copyright © 2022 by McGraw-Hill Education.
All rights reserved. No reproduction or distribution without the prior written consent of McGraw-Hill Education.
, a. Her accounting profits are $170,000. These are computed as the difference
between revenues ($200,000) and explicit costs ($30,000).
b. By working as a painter, Jaynet gives up the $110,000 she could have earned
under her next best alternative. This implicit cost of $110,000 is in addition to the
$30,000 in explicit costs. Since her economic costs are $140,000, her economic
profits are $200,000 - $140,000 = $60,000.
9.
a. Total benefit when Q = 2 is B(2) = 20(2) – 2*22 = 32. When Q = 10, B(10) =
20(10) – 2*102 = 0.
b. Marginal benefit when Q = 2 is MB(2) = 20 – 4(2) = 12. When Q = 10, it is
MB(10) = 20 – 4(10) = -20.
c. The level of Q that maximizes total benefits satisfies MB(Q) = 20 – 4Q = 0, so Q
= 5.
d. Total cost when Q = 2 is C(2) = 4 + 2*22 = 12. When Q = 10 C(Q) = 4 + 2*102 =
204.
e. Marginal cost when Q = 2 is MC(Q) = 4(2) = 8. When Q = 10 MC(Q) = 4(10) =
40.
f. The level of Q that minimizes total cost is MC(Q) = 4Q = 0, or Q = 0.
g. Net benefits are maximized when MNB(Q) = MB(Q) - MC(Q) = 0, or 20 – 4Q –
4Q = 0. Some algebra leads to Q = 20/8 = 2.5 as the level of output that
maximizes net benefits.
10.
a. The present value of the stream of accounting profits is
b. The present value of the stream of economic profits is
11. First, recall the equation for the value of a firm: ( ). Next, solve this
equation for g to obtain . Substituting in the known values implies a
growth rate of: or 3.55 percent. This would seem
to be a reasonable rate of growth: 0.0355 < 0.09 (g < i).
Managerial Economics and Business Strategy, 10e Page 3
Copyright © 2022 by McGraw-Hill Education.
All rights reserved. No reproduction or distribution without the prior written consent of McGraw-Hill Education.
,12. Effectively, this question boils down to the question of whether it is a good
investment to spend an extra $250 on a refrigerator that will save you $40 at the end
of each year for five years. The net present value of this investment is
.
You should buy the standard model, since doing so saves you $81.51 in present value
terms.
13. Under a flat hourly wage, employees have little incentive to work hard as working
hard will not directly benefit them. This adversely affects the firm, since its profits
will be lower than the $25,000 per store that is obtainable each day when employees
perform at their peak. Under the proposed pay structure, employees have a strong
incentive to increase effort, and this will benefit the firm. In particular, under the
fixed hourly wage, an employee receives $160 per day whether he or she works hard
or not. Under the new pay structure, an employee receives $330 per day if the store
achieves its maximum possible daily profit and only $80 if the store’s daily profit is
zero. This provides employees an incentive to work hard and to exert peer pressure on
employees who might otherwise goof off. By providing employees an incentive to
earn extra money by working hard, both the firm and the employees will benefit.
14.
a. Accounting costs equal $145,000 per year in overhead and operating expenses.
Her implicit cost is the $75,000 salary that must be given up to start the new
business. Her opportunity cost includes both implicit and explicit costs: $145,000
+ $75,000 = $220,000.
b. To earn positive accounting profits, the revenues per year should greater than
$145,000. To earn positive economic profits, the revenues per year must be
greater than $220,000.
15. First, note that the $200 million spent to date is irrelevant. It is a sunk cost that will be
lost regardless of the decision. The relevant question is whether the incremental
benefits (the present value of the profits generated from the drug) exceed the
incremental costs (the $60 million needed to keep the project alive). Since these costs
and benefits span time, it is appropriate to compute the net present value. Here, the
net present value of DAS’s R&D initiative is
Page 4 Michael R. Baye & Jeffrey T. Prince
Copyright © 2022 by McGraw-Hill Education.
All rights reserved. No reproduction or distribution without the prior written consent of McGraw-Hill Education.
, Since this is positive, DAS should spend the $60 million. Doing so adds over
$100,000 to the firm’s value.
16. Disagree. In particular, the optimal strategy is the high advertising strategy. To see
this, note that the present value of the profits from each advertising strategy are as
follows:
Since high advertising results in the profit stream with the greatest present value, it is
the best option.
17.
a. Since the profits grow faster than the interest rate, the value of the firm would be
infinite. This illustrates a limitation of using these simple formulas to estimate the
value of a firm when the assumed growth rate is greater than the interest rate.
b. * + * + billion.
c. * + * + billion.
d. * + * + billion.
Managerial Economics and Business Strategy, 10e Page 5
Copyright © 2022 by McGraw-Hill Education.
All rights reserved. No reproduction or distribution without the prior written consent of McGraw-Hill Education.
,18. If she invests $2,500 in pre-tax money each year in a traditional IRA, at the end of 4
years the taxable value of her traditional IRA will be
She gets to keep only 81 percent of this (her tax rate is 19 percent), so her spendable
income when she withdraws her funds at the end of 4 years is (0.81)($11,876.85) =
$9,620.25. In contrast, if she has $2,500 in pre-tax income to devote to investing in an
IRA, she can only invest $2,025 in a Roth IRA each year (the remaining $475 must
be paid to Uncle Sam). Since she doesn’t have to pay taxes on her earnings, the value
of her Roth IRA account at the end of 4 years represents her spendable income upon
retirement if she uses a Roth IRA. This amount is
.
Notice that, ignoring set-up fees, the Roth and traditional IRAs result in exactly the
same after-tax income at retirement. Therefore, she should adopt the plan with the
lowest set-up fees. In this case, this means choosing the Roth IRA, thus avoiding the
$50 set-up fee charged for the traditional IRA. In other words, the net present value of
her after-tax retirement funds if she chooses a Roth IRA,
is $50 higher than under a traditional IRA.
19. Yes. To see this, first note that your direct and indirect costs are the same regardless
of whether you adopt the project and therefore are irrelevant to your decision. In
contrast, note that your revenues increase by $13,369,300 if you adopt the project.
This change in revenues stemming from the adoption from the ad campaign
represents your incremental revenues. To earn these additional revenues, however,
you must spend an additional $2,860,050 in TV airtime and $1,141,870 for additional
ad development labor. The sum of these costs – $4,001,920 – represents the explicit
incremental cost of the new advertising campaign. In addition to these explicit costs,
we must add $8,000,000 in implicit costs – the profits lost from foreign operations.
Thus, based on the economically correct measure of costs – opportunity costs – the
incremental cost of the new campaign is $12,001,920. Since these incremental costs
are less than the incremental revenues of $13,369,300, you should proceed with the
new advertising campaign. Going forward with the plan would increase the firm’s
bottom line by $1,367,380. Expressed differently, the extra accounting profits earned
in the U. S. would offset the accounting profits lost from foreign operations.
Page 6 Michael R. Baye & Jeffrey T. Prince
Copyright © 2022 by McGraw-Hill Education.
All rights reserved. No reproduction or distribution without the prior written consent of McGraw-Hill Education.
,20. Under the projected 2% annual growth rate, analysts would view the acquisition
unfavorably since ( ) < $625.00 (in millions).
However, with an annual growth rate of 4% the acquisition is justified since
( ) > $625.00 (in millions).
21. Producer-producer rivalry exists between the European Steel Association and GOES
producers from Russia, Japan, China, South Korea, and the United States. A
consumer-producer rivalry exists between the European Steel Association and
European transformer manufacturers. Sustainability of profits in the GOES market is
questionable given the current circumstances. There are few low-cost alternatives to
GOES, but the presence of at least five separate countries producing at a level
generating significant exports indicates significant industry rivalry in the global
market. One result is that the intense rivalry between exporting countries and the
European Steel Association puts downward pressure on price. The GOES consumers,
represented by transformer manufacturers, and GOES producers, represented by the
European Steel Association and governments of the other five countries, are well
organized. The sustainability of profits in the European GOES market will be
determined by the relative success of buyers and sellers of GOES at convincing the
EU governments of the merits for the minimum price restriction and the amount of
time to keep it in place.
22. Online price comparison sites are generally markets of intense producer-producer
rivalry. Using the five forces framework, one would expect that profits in this
industry would be low. Given that there are many sellers, products are identical
across sellers, and that the main basis for competition is price, the industry rivalry
would be very high and prices would be expected to be close to cost. Furthermore,
barriers to entry are low, so that any profits would be competed away by new firms
entering the market. Also, consumers have a variety of substitutes available, both for
the products and the retail outlets from which they purchase. For these reasons,
economic profits would likely be close to zero for The Local Electronics Shop.
23. While the incentive plan has been effective in increasing the sales for the dealership,
it has not increased profitability. This is because the manager, who must approve all
sales, gets paid a commission regardless of whether the sale is profitable for the
dealership or not; she has an incentive to increase sales, not profits. A better incentive
system would pay the manager a commission based on the amount of the profit on
each sale. Doing this would give the sales manager an incentive to sell more cars and
maintain high profit margins. In this way, the incentives of the manager are better
aligned with the incentives of the dealership’s owners. Many car dealerships pay the
manager 20-30% of the gross profit, the difference between the selling price and the
cost to the dealership.
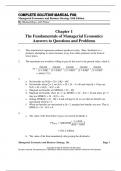
24. Marginal analysis can help us answer this question. Let’s revisit the figure,
reproduced below. Looking at Point A, it is clear that hiring this many sales people
ensures that benefits (revenues) equal costs (salaries), meaning net benefits are
Managerial Economics and Business Strategy, 10e Page 7
Copyright © 2022 by McGraw-Hill Education.
All rights reserved. No reproduction or distribution without the prior written consent of McGraw-Hill Education.
, exactly zero! However, Ms. Stevens’ objective is to maximize net benefits, and it is
easy to see from the figure that she can achieve net benefits much higher than zero.
We know that maximizing net benefits requires us to set marginal benefits equal to
marginal costs, which occurs at Point B in the figure (where the slope of total revenue
equals the slope of total salaries). At Point B, benefits are well above costs, so net
benefits are well above zero. Consequently, it appears Ms. Stevens’ sales division
would have done much better with a smaller sales force, as the analysts argued.
Figure 1-4
$
Total Sales Force Salaries
Total Sales Revenue
B A # of Sales People
25.
a. Cost = 0.74 + 0.10X2, where X is website analysis. The square of website
analysis is statistically significant, since its t-statistic is above 2 in absolute
value (12.96).
b. Revenue = 24.60 + 11.09X – 0.10X2. Both X and X2 are statistically
significant, since both have t-statistics above 2 in absolute value (8.38 and -
2.27, respectively).
c. Set MB(X) = MC(X) to find the level that maximizes net benefits. This
means we set 11.09 – 0.2X = 0.21X. Solving for X yields X = 27.05.
26.
a. Revenue = 968.68 + 71.77*X – 0.12*X2, where X is focus group size. Both
focus group size and the square of focus group size are significant, since both
have t-statistics great than 2 in absolute value (32.42 and -4.58, respectively).
Page 8 Michael R. Baye & Jeffrey T. Prince
Copyright © 2022 by McGraw-Hill Education.
All rights reserved. No reproduction or distribution without the prior written consent of McGraw-Hill Education.
, b. Costs = 510.70 + 49.17X + 0.11X2, where X is focus group size. Both focus
group size and the square of focus group size are significant, since both have
t-statistics great than 2 in absolute value (22.01 and 4.13, respectively).
c. Set MB(X) = MC(X) to find the level that maximizes net benefits. This
means we set 71.77 – 0.24X = 49.17 + 0.22X. Solving for X yields X = 49.
Chapter 2
Market Forces: Demand and Supply
Answers to Questions and Problems
1.
a. Since X is a normal good, a decrease in income will lead to a decrease in the
demand for X (the demand curve for X will shift to the left).
b. Since Y is an inferior good, an increase in income will lead to a decrease in the
demand for good Y (the demand curve for Y will shift to the left).
c. Since goods X and Y are substitutes, an increase in the price of good Y will lead
to an increase in the demand for good X (the demand curve for X will shift to the
right).
d. Not necessarily. The term ―inferior good‖ does not mean ―inferior quality,‖ it
simply means that income and consumption are inversely related.
2.
a. The supply of good X will increase (shift to the right).
b. The supply of good X will decrease. More specifically, the supply curve will shift
vertically up by exactly $3 at each level of output.
c. The supply of good X will decrease. More specifically, the supply curve will
rotate counter-clockwise.
d. The supply curve for good X will increase (shift to the right).
3.
a. units.
b. Notice that although , negative output is
impossible. Thus, quantity supplied is zero.
c. To find the supply function, insert Pz = 60 into the supply equation to obtain
. Thus, the supply equation is
. To obtain the inverse supply equation, simply solve this equation
for Px to obtain . The inverse supply function is graphed in
Figure 2-1.
Managerial Economics and Business Strategy, 10e Page 9
Copyright © 2022 by McGraw-Hill Education.
All rights reserved. No reproduction or distribution without the prior written consent of McGraw-Hill Education.
, $500
$400
Price of X
$300
$200
$100
$0
0 100 200 300 400 500
Quantity of X
Figure 2-1
4.
a. Good Y is a complement for X (since its coefficient is negative), while good Z is
a substitute for X (since its coefficient is positive).
b. Because the coefficient on income is positive, X is a normal good.
c.
d. For the given income and prices of other goods, the demand function for good X
is which simplifies to
. To find the inverse demand equation, solve for price to obtain
. The demand function is graphed in Figure 2-2.
$16,000
$14,000
$12,000
$10,000
Price of X
$8,000
$6,000
$4,000
$2,000
$0
0 1000 2000 3000 4000 5000 6000 7000
Quantity of X
Figure 2-2
Page 10 Michael R. Baye & Jeffrey T. Prince
Copyright © 2022 by McGraw-Hill Education.
All rights reserved. No reproduction or distribution without the prior written consent of McGraw-Hill Education.