3BA International Business: Summary International Monetary Economics
Chapter 1
International trade is the transaction of goods and services and International monetary economics is the transactions involving financial assets. I studies how
the interactions of national economies influence the worldwide pattern of industrial activity.
1. Exports and Imports as a Percentage of U.S. National Income and globalization
Both imports (what a country buys from another country, what they import) and exports (goods that a country sells to another) have risen as a
share of the U.S. economy, but imports have risen more (Shaded areas indicate U.S. recessions.)
Globalization
Globalization describes how trade and technology have made the world into a more connected and interdependent place. Globalization is not
going to go away, it will only become more modern
U.S. exports and imports as shares of gross domestic product have been on an upward trend.
International trade has roughly tripled in importance compared to the economy as a whole in the past 60 years.
Both imports and exports fell substantially in 2009 due to the recession.
Both imports and exports fell again in 2020 due to the COVID-19 pandemic.
International trade is even more important to most other countries than it is to the United States. If we look at the average of exports and imports
as percentages of National income, Belgium has the highest percentage of 87% and is thus highly dependent on International trade, then comes
Germany with 45%, Mexico with 43%, South Korea with 42%, Canada with 33% and only then the US with 15%.
2. Inflation
Inflation, the increase in prices over a given period of time has risen steadily recently. The years before that, for a long period we had low inflation
so we are speaking of a “return of inflation” -> The central banks responded to this high inflation by increasing the interest rate to discourage
people from spending more and thus bring down inflation -> But when will the ECB start cutting the interest rates and how low will they go?
If the interest rate > neutral interest rate: the central bank is going to adopt a restrictionary monetary policy where they are going to cut back on
spending or increase taxes. If the interest rate < neutral interest rate*: the central bank is going to adopt an expansionary monetary policy where
they are going to increase spending or cut back on taxes.
*The neutral rate of interest (long-run equilibrium interest rate) is the short-term interest rate that would prevail when the economy is at full
employment and stable inflation.
Chapter 2: National Income Accounting and the Balance of Payments
1. National Income accounts
National Income accounts Record the value of national income that results from production and expenditure
National income is often defined to be the income earned by a nation’s factors of production.
We will analyze national income identity
- producers earn income from buyers who spend money on goods and services
- the amount of expenditure by buyers = the amount of income for sellers = the value of production -> e.g. Every euro spend by one economic
agent is an euro earned by another economic agent -> Spending of one economic agent = earning of another agent.
2. National Income Accounts: GNP (=Gross National Product)
GNP is calculated by adding the value of expenditure on final goods and services produced:
- Consumption: expenditure by domestic consumers
- Investment: expenditure by firms on buildings & equipment
- Government purchases: expenditure by governments on goods and services
- Current account balance (exports minus imports): net expenditure by foreigners on domestic goods and services.
Example: In the US in 2020 -> total GDP was 22000 of which 14000 consumption, 3500 investment, 3000 government purchases and -500 current
account.
Useful to divide the GNP in difference parts and look at how they all change over time. In that way you can see what factors contributed to
changing the GNP.
There is a huge difference between economies of different nations, how the GNP is divided over the different components differs from country to
country -> e.g. in the cartoon, it Is implied that Germany is not “Fit” and thus has a bad economy while France and Spain over seen as “Fit”.
- Germany only had an economic growth rate of 2% with less than 0.5% in consumer spending, around -3 in investment, about 0.5 in
government spending but more than 4% in Net exports thus most of their economic growth comes from the current account.
- France had an economic growth rate of more than 4% with most coming from consumer spending with a little more than 4%, less than 0.5 on
investment, almost 3 in government spending and almost negative 3 in Net exports.
3. Breaking down GDP
1) Europe 2012-2015 -> Consumption has only grown relatively modestly, and investment scarcely at all, in Germany and the rest of the core. Instead,
core and periphery alike have relied on international demand for their exports. Between 2011 and 2015 the euro area’s trade surplus rose from
just 0.1% of euro-zone GDP to 3.7%. The dependency on exports makes Europa vulnerable to global growth. Where China’s economy to slow more
sharply or America’s to return to recession -> Europe would be growth decline as well.
2) China:
2007: Huge growth rates, compared to the rest of the world (Economy cannot keep growing at 10% each year) -> China’s economy is driven not by
exports but by investment, which accounts for over 40% of GDP since 2005, net exports have contributed more than 20% of growth and the
contribution of household consumption lower than in west -> Unbalanced economy.
, 2009: in the longer term, China needs to rebalance its economy by increasing consumption. In 2007, personal consumption only 35% but China
was investing 11% of GDP in low-yielding foreign assets, via its current account surplus and the net transfer of resources abroad was equal to a
third of personal consumption.
2010: Chinese growth is unbalances and highly dependent on investment as a source of demand and driver of supply -> it’s the most capitalist
economy ever. Thus, between 1997 and 2009, gross investment rose from 32 per cent to 46 per cent of GDP, while household consumption fell
from 45 per cent of GDP to a mere 36 per cent. This must be the lowest share of consumption in any significant economy ever. In a country with
hundreds of millions of poor people, it is even shocking.
2013: a highly unbalanced economy whose most striking feature is the extraordinarily low share of consumption, public and private, and
extraordinarily high share of investment (both close to half of GDP). Until last year, in which there was a small reversal, the rise in the investment
share had been rapid. At present, private consumption is about 35 per cent of GDP, roughly half the share in the US.
3) US:
2007-2009: For decades growth has been led by consumer spending. Thanks to rising asset prices and ever easier access to credit, Americans went
on a seemingly unstoppable spending binge. Consumer spending and residential investment rose from 67% of GDP in 1980 to 75% in 2007. The
household saving rate fell from 10% of disposable income in 1980 to close to zero in 2007. After the Financial crisis, Americans save more than 5%
of their after-tax income, still well below the post-war average but hugely up from only a year ago. The collapse in consumption has dramatically
changed the composition of America's economy. A huge increase in private saving has been offset by a leap in the budget deficit.
2022: US GDP grew at an annualized rate of 2 per cent in the July to September period. There
was a significant narrowing in the trade deficit as consumers spent more on services.
Consumer spending and investment weakened.
4) Spain 2022: “Prophets of doom” with economic expansion -> Gross domestic product inched up 0.2 per cent between the third and fourth quar-
ters of 2022, surpassing the 0.1 per cent forecast. Compared with the fourth quarter a year earlier, output rose 2.7 per cent, against 2.2 per cent
forecast by analysts. But the economy grew for the wrong reasons and the quarterly expansion was largely driven by rise in net exports as imports
fell 4.1%, reflecting the impact on demand from high inflation and rising borrowing costs. Household consumption was down 1.8%, investment fell
sharply.
5) Russia 2024: You would expect with the war that the economy is not doing well but it is. The IMF revised the GDP growth forecast to 2.6 this year, a
1.5 rise over last October. The war has an effect on growth but it is offset by Military Keynesianism -> Russia is directing a third of the country’s
budget the war effort, a threefold increase from 2021. They still have “colossal” revenues from its energy resources, despite sanctions.
4. National income identity
National Income must equal National Product
! only correct if GNP is adjusted
- depreciation (reduces income of capital owners)
NI = GNP - depreciation = NNP
- unilateral transfers (gifts from/to foreigners)
NI = GNP - depreciation + net transfers
- sales taxes
NI = GNP - depreciation + net transfers- indirect business taxes
Distinction of little importance for macroeconomic analysis! => two terms are used interchangeably
5. Difference between GDP and GNP
GDP is supposed to measure the volume of production within a country’s border, whereas GNP equals GDP plus net receipts of factor income from
the rest of the world. For the US, these net receipts are primarily the income domestic residents earn on wealth they earn in other countries less
the payments domestic residents make to foreign owners of wealth that is located in the domestic country.
GDP does not correct, as GNP does, for the portion of countries production carried out using services provided by foreign owned capital and labor.
Example: The profits of a Spanish factory with British owners are counted in the Spain’s GDP but are part of Britain’s GNP. The services British
capital provides in Spain are a service export from Britain and therefore they are added to British GNP in calculating British GNP. To figure out
Spain’s GNP, we must subtract from its GDP the corresponding service import from Britain.
GNP = GDP - 'domestic' income earned by foreigners + 'foreign' income earned by domestic residents
GNP = GDP + net receipts of factor income from ROW
Different criterion: ‘nationality’ (GNP) vs. location (GDP).
6. National Income Accounting for an Open Economy.
National income identity for a closed economy
NI = GNP
Y = C + I + G = we generate income domestically only by the country’s
consumption, investment and government purchases.
National income identity for an open economy
Y = C + I + G + (EX - IM) -> Y = sales to domestic residents + sales to foreign residents
7. The Current Account and Foreign Indebtedness
Current account (balance) is important concept, it Measures size and direction of international borrowing.
△CA => △Y => △employment
CA = Y - (C + I + G) = national income - spending of residents
CA deficit -> buys more from foreigners than it sells to them. country uses more output than it produces (spending > income). If we have a CA
deficit, the left side of the equation is negative and thus the right side is negative as well, this happens when the spending of the residents is
greater than the income -> Debt -> Deficit financed by borrowing abroad => foreign indebtedness increases
CA is a flow variable, measures what happens in a specific economy in a specific period of time. It is a flow variables that measures the difference
between imports and exports.
, CA = △ foreign wealth
- Foreign wealth is the difference between financial claims that they have on your country and the claims your country has over other
countries. It is a stock variable, it is build over time and measures the evaluation over a limited period of time. Ca measures the change in
foreign wealth because it is the sum of all the country’s CA deficits and surpluses.
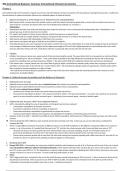
8. The U.S. Current Account and Net International Investment Position, 1976–2019
A string of current account deficits starting in the early 1980s reduced America’s net foreign wealth until, by the early 21st century, the country had
accumulated a substantial net foreign debt. The US has been having a CA deficit ever since the 1980 with an exception in 1991 (1990 was the year
of the golf war, in 1991 Saudi Arabia paid back military expenses to US;
A graph plots the US current account and net foreign wealth in billion of dollars from 1976 to 2018. Plot of current account falls from 0 in 1976 to -
500 in 2004, rises to -400 in 2018. Plot for foreign wealth rises from 0 in 1976 to 300 in 1980, falls to -1000 in 1997 to -2200 in 2004, rises in 2007
to -1200 and falls in 2008 to -4000, rises again in 2010 to -2500 and falls to -11500 in 2018.
The US is the world’s biggest debtor
Case study: At the end of 2012, the United states had a negative net foreign wealth position far greater than that of any other country, at the start
of 2020, it stood at about 50% of GNP.
A qualification? -> In 2004, America had a current-account deficit of 668 billion, it had to borrow this amount from the rest of the world, but
numbers show that America’s net external liabilities rose by only 170 billion in 2004 to 2.5 trillion. Since the end of 2001, America’s current-
account deficit has amounted to 1.7 Trillion yet, the net external liabilities only increased by 200 billion and have fallen as a % of GDP.
Every year that we have a CA deficit, foreign wealth should detoriate, but this is not always the case. If you take the difference between two
variables, they must be expressed in the same currency. At a point in time, where the dollar is strong or where, there is a difference => Exchange
rate effect (=When exchange rates change, the prices of imported goods will change in value) and the value of your financial assets can change ->
Price effect (=Market value can change)
9. Valuation effects
US net foreign wealth ( ) = US-owned foreign assets (/) – foreign-owned US assets (=/)*
American portfolio: mostly in foreign currencies => decline of USD lifts value of overseas investments, riskier assets => ROR >7% over 2002-2004
- Positive valuation effect: When for a given amount of currency you get a higher amount of dollars.
Foreign portfolio -> mostly in dollars => not affected by ER, low risk => ROR only 3.4%
*2 arrows means a greater positive valuation effect.
10. Valuation effects, UK
Brexit, referendum -> Pound weakened -> Positive valuation effect on the net investment position of the UK
UK international assets have grown faster than liabilities, there has been a change in the nation’s global investment position mainly due to
Currency movements + mix of assets.
Britain is the worst offender, among major western economies in terms of imbalances. One good catch all measure for imbalances is the current
account balance, effectively an aggregator of the fiscal, household and corporate sector imbalances. The UK is now running a deficit equivalent to 8
per cent of GDP. The country is living on the “kindness of strangers”.
11. US trade deficit
In 2006: Two out of every three containers that arrive in the US from China, leave empty. US hardly exports anything back to China.
US has a bilateral Trade arrangement with China -> China, a country with a surplus is lending to US.
The U.S. has racked up 2.69 trillion in net debt to the rest of the world, a record run of charges on the national credit card -> U.S. is like a consumer
with a platinum card. Big bills aren’t a problem as long as there is enough income to service them -> For a consumer, that means a reliable
paycheck and for a country that means economic growth that is fast enough to generate returns foreigners seeks when they lend it money.
Problems arise, if growth in the US slows relative to other countries and foreigners look for returns elsewhere.
US trade deficit with China in 2016: Imports from China are much larger than the exports from the US going to China.
Cartoon: Countries are bed are ill (UK, US, Italy, Greece, Austria) and need financing from other countries, these represent the IV (China, Japan).
Global imbalances: We have a lot of countries with current account surpluses but also lots of countries with current account deficits. The countries
with a surplus such as China, Oil exports, Japan, Netherlands, Switzerland, Singapore, Taiwan, Swede, Malaysia lend to countries with a deficit such
as US, Spain, UK, France, Italy, Australia, Greece, Turkey, India, Portugal.
US Has a large CA deficit but compared to the percentage of the GDP is it not that bad.
12. Automatic adjustment?
Normally, the currencies of economies with large current account deficits should depreciate (weaken) relative to those of countries with surpluses
and this can help to mitigate the problem -> This will stimulate their exports and curb imports, thereby helping to slim the trade gaps. America has
the world’s biggest current-account deficit and the dollar has been falling since 2002.
The currencies of many other countries with large deficits had enjoyed big gains until recently e.g. New Zealand, where the deficit reached 8% of
GDP (bigger than America’s deficit of 6% of GDP) saw its currency gain 28% over the same period -> the result is ‘carry trade’ -> Higer interest rates
paid by countries with large external deficits were supposed to compensate investors for the risk of currency depreciation. But as investors
borrowed in low-interest currencies, such as the yen, to invest in high yielding ones, this made the latter currencies stronger -> That prolonger
global imbalances by making it easier for profligate countries to finance their current-accounts deficits.
Carry trade: Investment Strategy where you borrow in a country with a low interest rate in the currency of that currency and then you are going to
invest that money in another country with higher interest rates -> Risky because after some time you need to pay back the original loan but it is
possible that the foreign currency has appreciated (If there is a high demand for a certain currency, that currency will appreciate).
In the graph, countries with a surplus, above zero line: currency strengthens and for the countries with a deficit, below zero line: currency
weakens.
In 2014, the situation in the US has improved -> CA deficits have halved but a smaller CA deficit is not enough, cause we are still borrowing from
other countries. Financial position can only improve if we have a surplus.
, 2016: Global imbalances are back -> The recession that followed the crisis temporality reduced the global imbalances but a sustained era of
balanced growth failed to emerge. Instead, surpluses in China and Japan rebounded. In the recent years, Europe has followed, thanks to a big
switch from borrowing to saving. Within the euro area, the struggling Mediterranean economies need faster rates of GDP growth to bring down
unemployment and stabilize government debt. Germany’s enormous surpluses mean that its households are buying less from other countries like
Greece than they ought to and that hurts the growth prospects of the periphery.
Current account deficits went down but not because the surpluses of other countries went down, they even went up.
Cartoon: Shopping cart of America, American economy is financed by saving of others (Eurozone, Japan, China).
13. Two related causes: US – CN (China)
The huge trade imbalance between the US and China has two related causes: net surplus savings in China I.e. domestic saving far beyond that
which is needed to finance domestic investment and an even bigger net saving deficiency in America.
Contrary to the widely held beliefs in both China and the US, a discrete appreciation of the yen against the dollar would not reduce China’s trade
surplus or America’s trade deficit. A discrete appreciation of the yen could have the perverse effect of causing investment in China to slump, as
firms see China becoming a higher-cost area. This could drive up China’s already high net savings rate, thus increasing its trade surplus with the U
14. Two related causes: DE (Germany)- GR (Greece)
“No economy is an island” -> realisation that was missing from the analysis of the current state of the eurozone by Jürgen Stark -> he said that
Germany has reliably pursued a prudent economic policy. While others were living beyond their means, Germany avoided excess. Yet income and
spending has to add up across the world economy. Some can live within their means only because others do not. The prudent depends on the
imprudent.
What one saw inside the pre-crisis eurozone was the combination of low interest rates with a burgeoning of cross-border net lending -> it is nearly
certain that soaring excess of saving over investment in Germany caused excess borrowing and spending elsewhere.
On August 24th, figures revealed a larger than expected budget surplus is the first half of 2016 and put Germany on track for its third year in a row.
Greece were half as fiscally responsible as Germany and might be facing its eight year of economic contraction in a decade -> German saving and
Greek suffering are two sides of the same coin. Seemingly prudent budgeting in Economies like Germany’s produce dangerous strains globally. The
pressure may yet be the undoing of the euro area.
German frugality and economic woes elsewhere are linked through global trade and capital flows.
15. Saving and the Current Account
Let us now introduce the concept of national saving -> the proportion of output that is not devoted to household consumption or government
purchases
S=Y-C–G
In a closed economy: Y = C + I + G => S = I -> closed economy can only increase its wealth (save) by accumulating new capital. The only way to have
a profitable investment is to increase domestic investment.
In an open economy you can also invest in other countries. National saving can be used foreign or domestically.
Y = C + I + G + (EX - IM)
Y = C + I + G + CA
Y - C - G = I + CA => S = I + CA or I = S – CA
Interpretation?
• Open economy can save either by building up its capital stock or by acquiring foreign wealth
• S = I + CA means that it is possible to raise investment and foreign borrowing without changing saving.
• CA deficit means that a country receives from abroad. In some situations it would be positive to have a capital deficit, if you manage it
well (not misusing the capital that comes in). Having a surplus is not always positive.
• Conversely: CA surplus often called net foreign investment
When are imbalances worrying? -> Current account imbalances are not always a cause for concern. They measure the gap between domestic
savings and investment. The euro area is an economy with an ageing population: it should save more than it invests and as a result it should have a
currency account surplus. America’s deficit partly reflects the more attractive investment opportunities available there than elsewhere in the
world. Imbalances becomes more worrying if they are larger than economic fundamentals might suggested or if financed by short-term inflows.
Example in a closed economy
S I China saves more than the investment opportunities that they have and The US has more investment opportunities
China 100 80 that they have in savings, so they cannot pursue them all since in a closed economy S = I
US 20 40
When S > I -> R and then S -> I and when S < I -> R -> S but I
With an open economy, we can have a current account
China: + 20 -> US: - 20 => China gives to the US so the US can finance their investment opportunities. This can be beneficial to both when the size is limited.
16. Private and Government Saving
Let us now introduce the distinction between private and government saving
Sp = Y - T – C
Sg = T – G
S = S p + Sg
Rewrite national income identity to see how Sg influences macroeconomic conditions -> Sp = I + CA + (G-T)
Because Y = C + I + G + CA and Sp = Y - T – C
Thus Sp = C + I + G + CA -T -C = Sp = I + CA + (G-T)
Interpretation of Sp = I + CA + (G-T)? -> it states that a country’s private savings can take three forms:
- Investment in domestic capital (I)
- purchase of wealth from foreigners (CA)