Statistical Modelling for Communication Research
Week 1:
Chapter 1: Sampling Distribution
● Statistical inference/inferential statistics: making inferences about the population from
the sample (generalization), through estimation and null hypothesis testing
○ Sample = random (usually)
● Sample statistic: value describing a characteristic of the sample (one outcome score)
○ E.g., how many yellow candies in a sample
○ Also called a random variable
● Sampling space: collection of all possible outcome scores/sample statistics
○ E.g. all possible quantities of yellow candies in a sample
● Sampling distribution: includes the characteristics of different possible samples that
could’ve been drawn from the population
○ All the possible sample statistic values & their probability/ probability density
○ distribution of the outcome scores of many samples
○
■ (it’s not always a normal distribution)
● Cases: the ‘things’ that are being counted→ units of analysis
● To calculate probability of a sample statistic outcome: divide number of samples with
desired outcome (e.g. all samples with 5 yellow candies) by the total number of samples
● Probability distribution: shows the probability of all outcomes in the sampling space
(changes frequency in a sampling distribution to probability)
○ Discrete: when only a limited number of outcomes are possible so you can list the
probability of each outcome separately
● Probablity density: a means of getting the probability that a continuous random variable
(like a sample statistic) falls within a particular range
● Expected value: average (mean) of the sampling distribution of a random variable
○ population proportion x total number of cases in the sample
○ The mean of a probability distribution, e.g a sampling distribution
○ If a sample statistic is an unbiased estimator of a parameter (population value), the
parameter value equals the average of the sampling distribution, which is called
the expected value or expectation
, ● Sample statistic is called an unbiased estimator of the population statistic (proportionally;
the % of yellow candies in a bag can estimate the % of yellow candies in the factory)
● Unbiased estimator: A sample statistic for which the expected value equals the
population value
● [The sampling distribution collects a large number of sample proportions. The mean of
the proportions in the sampling distribution (expected value) equals the proportion of
yellow candies in the population, because a sample proportion is an unbiased estimator of
the population proportion.]
● Population statistic AKA parameter
● We say a random sample is in principle representative or representative in the statistical
sense of the population bc it’s not always gonna be a super exact representation of the
population
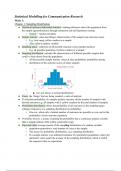
● Draw 1000s of samples, calculate the mean → get true population value
● Continuous variable: We can always think of a new value in between two values
○ w/ continuous sample statistics, look at range of values
○ Probability of a (range of) outcomes is calculated using probability density
function, which calculates the area of part of the sample distribution graph
(probability = area of section)
■
■ Probability density function gives probability of values between two
thresholds (blue section)
■ Left-hand probability: values up to and including a threshold value (red
section)
■ Right-hand probability: values including and above a threshold value
(green section)
■ ^ left and right used to calculate p value
■ Total probabilities ALWAYS = 1!
● Parameter = population mean
● Random Variable: A variable that depends on chance
Micro lecture 1: The empirical cycle
● Observation
, ○ Sparks an idea for hypo → pattern, unexpected event, interesting relation we want
to explain
■ Source not important (personal, shared, imagined, previous research)
○ Observing relation in one or more instances [Induction]
● Induction
○ Specific to general
○ With indicative reasoning relation in specific instances is transformed into general
rule or hypo
● Deduction
○ Relation should hold in new instances
○ expectation / prediction is deduced abt new observations
○ Determine research set up
○ Define concepts, measurement instruments, procedures, sample
→ hypo is transformed with deductive reasoning & specification of research setup
● Testing
○ Inferential: decide
○ Descriptive: summarise statistical processing
■ compare data to prediction
■ Data collection
○ New data collected & w the aid of stats → compared to predictions
● Evaluation
○ Interpret results in terms of hypo
○ Prediction confirmed → Hypo provisionally supported - NOT proven
○ Preiction disconfirmed → hypo not automatically rejected - repeated with better
research set up
○ Hypo rejected (very rare)
Lecture 1:
● Empirical Cycle E.g:
, ● What is the difference between; population distribution, sample distribution, sampling
distribution?
● Two hypothesis:
○
H0 HA
Skeptical POV Refute skepticism
No effect Effect
No preference ` preference
No correlation Correlation
No difference Difference
● Frequentist probability
○ Objective probability
○ Relative frequency in the long run
Tutorial 1:
● In a continuous variable, to find the probability of a single specific value = 0
● The mean of a sampling distribution is equal to the population value only if it is an
unbiased estimator
○ If we change the population proportion, the center of the sampling distribution
changes accordingly
● Larger samples create sampling distributions that are more peaked
Week 2:
Chapter 2: Probability Models
● 3 ways to construct a sampling distribution when you draw only 1 sample:
1. Bootstrapping
● Sampling with replacement from the original sample to create a sampling
distribution
2. Exact approach
● Calculate the true sampling distribution as the probabilities of
combinations of values on categorical variables
3. Theoretical approximation
● Using a theoretical probability distribution as an approximation of the
sampling distribution
● Independent samples: samples that in principle can be drawn separately
● Dependent/ paired samples: the composition of a sample depends partly or entirely on the
composition of another sample
Les avantages d'acheter des résumés chez Stuvia:
Qualité garantie par les avis des clients
Les clients de Stuvia ont évalués plus de 700 000 résumés. C'est comme ça que vous savez que vous achetez les meilleurs documents.
L’achat facile et rapide
Vous pouvez payer rapidement avec iDeal, carte de crédit ou Stuvia-crédit pour les résumés. Il n'y a pas d'adhésion nécessaire.
Focus sur l’essentiel
Vos camarades écrivent eux-mêmes les notes d’étude, c’est pourquoi les documents sont toujours fiables et à jour. Cela garantit que vous arrivez rapidement au coeur du matériel.
Foire aux questions
Qu'est-ce que j'obtiens en achetant ce document ?
Vous obtenez un PDF, disponible immédiatement après votre achat. Le document acheté est accessible à tout moment, n'importe où et indéfiniment via votre profil.
Garantie de remboursement : comment ça marche ?
Notre garantie de satisfaction garantit que vous trouverez toujours un document d'étude qui vous convient. Vous remplissez un formulaire et notre équipe du service client s'occupe du reste.
Auprès de qui est-ce que j'achète ce résumé ?
Stuvia est une place de marché. Alors, vous n'achetez donc pas ce document chez nous, mais auprès du vendeur wj004. Stuvia facilite les paiements au vendeur.
Est-ce que j'aurai un abonnement?
Non, vous n'achetez ce résumé que pour €7,46. Vous n'êtes lié à rien après votre achat.