Full summary of the book statistics for business and economics
36 vues 0 achat
Cours
Statistics for Pre-MSc A&C/SCM/TOM (EBS027A05)
Établissement
Rijksuniversiteit Groningen (RuG)
Book
Statistics for Business and Economics
Summary of the book statistics for business and economics (fifth edition) for the pre master SCM/TOM and A&C.
Samenvatting van het boek statistics for business and economics (fifth edition) voor de pre master SCM/TOM en A&C
Samenvatting Statistics for Business and Economics - Statistics Pre-MSc (EBS029A05)
Tout pour ce livre (6)
École, étude et sujet
Rijksuniversiteit Groningen (RuG)
Bedrijfskunde: Business & Management
Statistics for Pre-MSc A&C/SCM/TOM (EBS027A05)
Tous les documents sur ce sujet (1)
Vendeur
S'abonner
SamTBK
Aperçu du contenu
Statistics for Pre-MSc SCM & TOM – Knowledge clips summary
Book: statistics for business and economics, fifth edition, ISBN: 9781473768451
Clip 1: the role of statistics and data -> chapter 1
- Statistics is the art and science of collecting, analyzing, presenting and
interpreting data.
It provides information for decision making.
- Databases = can be used for statistical analysis
- All information in these databases provide an overview of multiple aspects.
It can be used to find out drivers of product sales for example.
- Big data = everything is stored on servers (information, personal info etc)
- Data sciences helps to support decisions based on calculations.
Nowadays big data is valuable information for finding out relevant things to
investigate into detail -> the behavior of customer can be examined.
Terminology in statistics:
- Database / data set = total number of information / numbers in a sheet
- Columns = variables -> vertical axis
- Rows = observations / cases -> horizontal axis
- Each cell = measurement / data point
Types of variables: level of measurement
- Ratio = the same as interval but true zero exist (0 years old)
- Interval = the difference between the skills is the same (10-20 degrees is the
same difference as 30-40 degrees)
- Ordinal = a category with an order (sport competition; 1 st, 2nd, 3th)
- Nominal = a label, description, a category
Ration and interval = metric / numerical data
Ordinal and nominal = categorical data
, - Important consequences for what you can do statistically / mathematically with
the variable
From nominal to ratio = data becomes more powerful, less restrictive
Examples with data:
- Nominal = data can be male or female -> no average can be found
- Ordinal = data can be unsatisfied, neutral, or satisfied (ranking) -> no
differences between variables can be derived
- Interval = differences in data can be drawn, but no true zero -> 15 degrees is
not half of 30 degrees, it is incorrect, and thus can’t be said
- Ratio = differences between data can be drawn -> someone who is 40 is twice
the age of someone who is 20
Types of data sets
- Cross sectional data = sample of individuals, during a time period
Survey of cases (among customers for example)
- Time series data = mostly used in finance -> variables measured over time
The change of stock prices over a long period of time
- Panel data = combination of both -> multiple cases and same variables
measured at multiple time points
Every year you send out the same survey at the same time -> makes it
possible to see differences during a time period (purchase behavior)
It is popular for marketing = data can be used to see how people react to
price changes and how their purchase behavior will be affected
Sources of data:
, - Primary data = data is collected during a survey for example -> high level of
control -> what variables, what people to interview
- Secondary data = information that is already acquired based on running their
business, mostly automatic -> can be used for a different purpose (less
control)
Both data can be combined to get a better understanding of the data =
secondary data can be enriched with collection of primary data that
matches the secondary data
Statistics is a way to get information from data:
- Some questions = What is the average time between purchases of customers,
what is the average leadtime of goods?
- Data is used in statistics to make a conclusion.
- Data is based on a sample; you want to draw a conclusion on a population.
Key statistical concepts:
- Population = a population is the group of all items/ cases of interest
, One wants to draw conclusions on this group.
- Sample = a sample is group of items/ cases drawn from the population
One applies statistical analysis on the data from a sample.
When you can’t study the whole population, you do it based on a sample
within that population to draw a conclusion on that population -> the larger
the sample size the higher the accuracy
From a population a random sample is drawn -> variable (e.g. money) will be
measured and histogram can be made -> standard deviation (SD) and average can
be computed -> it can be put into a distribution graph with the mean and SD -> based
on the graph something can be said about the population
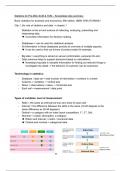
Statistics & the empirical cycle -> used in sciences
- Theory = in sciences theories about the
behavior of consumers are proposed
- Hypothesis = propose a hypothesis: e.g.
if prices go down, sales go up
- Observations = data collection is
needed to get observations
- Empirical findings = test your findings
and make theory based on the data
This circle is used to test theories
and propose new theories
Clip 2: tables and figures -> chapter 2
Statistical methods
Les avantages d'acheter des résumés chez Stuvia:
Qualité garantie par les avis des clients
Les clients de Stuvia ont évalués plus de 700 000 résumés. C'est comme ça que vous savez que vous achetez les meilleurs documents.
L’achat facile et rapide
Vous pouvez payer rapidement avec iDeal, carte de crédit ou Stuvia-crédit pour les résumés. Il n'y a pas d'adhésion nécessaire.
Focus sur l’essentiel
Vos camarades écrivent eux-mêmes les notes d’étude, c’est pourquoi les documents sont toujours fiables et à jour. Cela garantit que vous arrivez rapidement au coeur du matériel.
Foire aux questions
Qu'est-ce que j'obtiens en achetant ce document ?
Vous obtenez un PDF, disponible immédiatement après votre achat. Le document acheté est accessible à tout moment, n'importe où et indéfiniment via votre profil.
Garantie de remboursement : comment ça marche ?
Notre garantie de satisfaction garantit que vous trouverez toujours un document d'étude qui vous convient. Vous remplissez un formulaire et notre équipe du service client s'occupe du reste.
Auprès de qui est-ce que j'achète ce résumé ?
Stuvia est une place de marché. Alors, vous n'achetez donc pas ce document chez nous, mais auprès du vendeur SamTBK. Stuvia facilite les paiements au vendeur.
Est-ce que j'aurai un abonnement?
Non, vous n'achetez ce résumé que pour €6,49. Vous n'êtes lié à rien après votre achat.