Summary of health economics and mathematical models of infectious diseases. It includes class notes of every slide, results for exercises and some summaries.
Health Economics & Mathematical modelling of infectious diseases
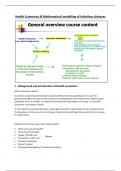
1. Background and introduction of Health economics
What is Economics about?
Economics is about how the decisions made by different entities (individuals, firms and the
government) affect the way in which resources are distributed in the achievement of goals (set by
individuals, firms or society). It is about how we deal with the problem of scarcity. In a nutshell:
Economics is the study of choice.
→ the resources are distributed over a set of goals and will not be possible to use somewhere else.
The abundance of the resources is not large enough to do everything that you want to do, you have
to make choices.
Health economics has some main subjects/topics:
• What is the value of health?
• Determinants of health
• Supply of health care
Market
• Demand for health care
• Economic evaluation
• Equity (~justice)
• Planning and budgeting (~accountancy aspect)
,A. Determinants of health and health production
What determines good health?
Health can be measured as:
• Reduced mortality rates (~1/Life Expectancy)
• Reduced morbidity
• Reduced disability
• Improved self-reported health status
Self-reported health status is the health status that the people think they have/what people
state about their own health. This is usually a very good indicator for the real health status of the
person. That is why this is used quit often.
Welfare and Health
Health is determined by Life expectancy at
birth = the probability of dying at a certain
age = mortality rate. Welfare is indicated by
income (GDP = income of countries on a log
scale).
On average at this time the life expectancy
was around ±45 years. This does not mean
that there were no people older than 45. The
size of the circle is the proportion of the
population at that time.
You see that 100 years later the wealth has
increased much more than the life
expectancy (health). Almost all the countries
do not exceed the 50 year line. The richer
countries have a higher life expectancy.
In 1918 there was a drop down because of the
Spanish flu. The wealth and life expectancy
continued to increase with the years. Saudi
Arabia grew in wealth because the petrol
prices increased. But the wealth was not good
divided, so their life expectancy is not as high
as the other riche countries.
2
, This is a Log scale.
This is a linear scale. It looks like a
production function = the input
increases but the output will not
increase anymore at a certain point.
This is the same with the countries.
When the country’s wealth increases,
they increase rapidly in life
expectancy, but at a certain wealth
the life expectancy will not increase
anymore.
So, the difference in welfare is not correlated to the difference in health. Once the basic welfare is
reached, you get to a position where welfare has no influence anymore on health.
From 1975 the life expectancy was increasing but after 1990 there was a drop. The drop down is
because of HIV transmission that caused a lot of AIDS patients. It effected the life expectancy of
South Africa a lot and also the income of families. Before 2000 ART (anti-retroviral treatment) was
only available for riche countries. In the early 2000 the prize of ART decreased and made it more
available for the population in Africa and caused an increase in the life expectancy. So, you do have
some occasional chocks (pandemics, war, …) that can bring the life expectancy down but after that
the countries normally grow back to the original growth path because of the basic welfare and basic
capacity of the health care system that are still intact.
3
, Here you see the demographic
and epidemiological transition
that occurred in most of
Europe. This is illustrated here
for England and Wales. On the
left you have the situation in
1891 and on the right, you have
1966 (75 years later). It is the
same population but the
population itself has
completely replaced. In 1891
the percentage of the total
population is declining by age.
Most of the population are
young people. But under the age of 5 you have the highest percentage of total deaths. When we look
at the right graph of 1966, we see that the mortality is the highest in the older ages and decreased
enormously in younger ages. The changes from 1891-1966 are cause by better hygiene, medical
practice, vaccination and development of antibiotics. You see a demographic transition from 1891 to
1966 which is that you go from high mortality rand birth rate to low mortality and birth rate. It is also
called an epidemiological transition because you go from a situation where most of the deaths were
due to a few short-lived diseases to a situation where most of the deaths are due to more chronic
manifestations of disease and much less often related to infectious diseases.
Which factors determine that some people are healthier than others?
Lifestyle of people determine their health status, which is based on income, socio-economics status,
education, age and gender …
The life expectancy
decreases with age and the
probability of dying
increases with age and
there is also a difference
between the different
genders.
The difference between the
gender is declining because
once you reach a certain
age the man and women
are dying at the same rate.
Men die faster than women
because of their lifestyle,
more risky behaviour.
4
Les avantages d'acheter des résumés chez Stuvia:
Qualité garantie par les avis des clients
Les clients de Stuvia ont évalués plus de 700 000 résumés. C'est comme ça que vous savez que vous achetez les meilleurs documents.
L’achat facile et rapide
Vous pouvez payer rapidement avec iDeal, carte de crédit ou Stuvia-crédit pour les résumés. Il n'y a pas d'adhésion nécessaire.
Focus sur l’essentiel
Vos camarades écrivent eux-mêmes les notes d’étude, c’est pourquoi les documents sont toujours fiables et à jour. Cela garantit que vous arrivez rapidement au coeur du matériel.
Foire aux questions
Qu'est-ce que j'obtiens en achetant ce document ?
Vous obtenez un PDF, disponible immédiatement après votre achat. Le document acheté est accessible à tout moment, n'importe où et indéfiniment via votre profil.
Garantie de remboursement : comment ça marche ?
Notre garantie de satisfaction garantit que vous trouverez toujours un document d'étude qui vous convient. Vous remplissez un formulaire et notre équipe du service client s'occupe du reste.
Auprès de qui est-ce que j'achète ce résumé ?
Stuvia est une place de marché. Alors, vous n'achetez donc pas ce document chez nous, mais auprès du vendeur UAFBDBMW. Stuvia facilite les paiements au vendeur.
Est-ce que j'aurai un abonnement?
Non, vous n'achetez ce résumé que pour €11,99. Vous n'êtes lié à rien après votre achat.