ECONOMY AND SOCIETY
Written exam:
MCQ: 50%
2 open Q’s: 50% ➔ list on Canvas
→ sample MC on each class
CLASS 1: INTRODUCTION
S1: Economics1 has often been criticized because it tried to mimic natural sciences, trying to base itself
on mathematic models, etc.
S2: What is (comparative) political economy?
E&S is mostly an introduction into PE. Political economy often seen in social sciences & geography.
2008: according to some science; was the worst economic crisis in human history. Was systemic crisis:
risk of a simultaneous explosion of both the US & EU banking system.
If you study politics today in the west, you get taught mainstream/neo-classical economics; focusing on
the capitalist system. Political economy: looks at the social linked to economy. They don’t believe you
can look at an economic crisis without looking at power, banks, economic policies…
S3: anti-system parties have significantly increased since the 90s; there’s an explosion in scholarly work
about it and it is argued that we can’t study this without looking at what happens parallel in the
economy & growing economic insecurity.
2008 crisis = deepest since 1930s or even in history. Threefold:
1) banking crisis: private banks gave too much credit to households → creating bubbles in housing
markets2. When bubbles collapsed, big banks had to be bailed out by governments to save banking
industry & stabilize economy (‘too big to fail’ → ‘if they can’t fail, they’re too big’). → ↑ ↑ public debt.
→ this triggered a:
2) fiscal crisis: in weak Eurozone states. → to reduce debt: drastic cuts in social spending & harsh
austerity policies on citizens. → resulted in:
3) crisis of the real economy: low economic growth or stagnation & unemployment.
2020 ‘The Great Lockdown’ = exogenous shock to advanced capitalist system.
2008: endogenous to the system = 1) an outgrowth of financialization of the economy & 2) outcome of
growing levels of income & wealth inequality.
→ since 80’s: unequal distribution of gain in economic growth. E.g. 2016: total national income for top
10% earners in EU = 37% and US = 47%.
➔ the rise in inequality marks the end of a post-war ‘Golden Age’ of egalitarian capitalism.
→ all Anglo-Saxon countries: middle- and lower-classes had to ↑↑ borrow money3 to finance their
consumption4 patterns. I.e.: inequality leading to household debt = contribution to 2008. Reinforcing:
fiscal austerity hurting bottom half of income distribution (since they are the once who rely most on
1 the study of how society manages its scarce resources
2 a group of buyers and sellers of a particular good or service
3 the set of assets in an economy that people regularly use to buy goods and services from other people
4 spending by households on goods and services, with the exception of purchases of new housing
1
,social system) → high inequality levels can cause low economic growth & secular stagnation. ↑
consensus that high inequality can endanger liberal democracy. → West: cynical about value of
democracy & idea that they could have influence on public policy. Since 80s: trust & party participation:
↓↓. → ↑ single-issue movements, populism, anti-system parties.
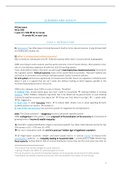
S4: a clear example: an important cause of Trumps election was economic: this map shows the amount
of job losses as a result of trade with China. → local economies in the US have been flooded with
Chinese products, making themselves obsolete.
S5: and we can see that the places where they’re most touched by this, voters have switched from
democrats to republicans.
So why do so many blue-collar workers vote for a billionaire like Trump? Because he was very
protectionist & explicitly blamed the Chinese for taking people’s jobs & promising otherwise → which
wasn’t very successful & could explain why some states have switched back again to vote for Biden in
the last elections.
S6: a graph that summarizes the entire course. Correlation between income inequality & financial
instability. This doesn’t mean a causal relationship, yet that’s what this course will want to explain.
Link with rise of inequality, vs. populism. SO: Capitalism & it’s instability = inherent tendency to fuel
inequality.
S7: this course = advanced capitalism from a political economy perspective: can only know market-
functioning if you know political context. → break down disciplinary boundaries. its opposite:
neoclassical economics: dominant way to study economics: formalistic, mathematical, quantitative
(simplistic, unrealistic, conservative, too optimistic about efficiency 5 of free markets & pessimistic
about effectiveness of government intervention) & detached from social, political & historical (real
world). Non-proven assumptions:
1) homo economicus: we’re rational, self-interested, maximizing our utility by using full information.
Only for them to be quantified & modelled in a graph, not because they’re true/sensible.
2) self-adjusting: free markets balance supply & demand in long-term. After shock, always return to
equilibrium6. → liberal bias: means government can only be excessive. → SO: = ideological support for
excessive deregulation of the banking system. → = a cause to 2008.
YET: want to predict, not be realistic. BUT bad track record: 2008 was a surprise.
→ 2008 exposed neoclassical economics’ failures. → need to teach economics differently: pluralistic &
real-world problems (e.g. inequality & instability).
Political economy = as bad with predictions BUT better at explaining causes. Because e.g. looks at
relation between economy vs. power & politics (neo-classical economists say they can be separate).
E.g. US since 1978: inequality result of the political (NOT natural nor inevitable through technological
innovation & competition in globalization). → balance of power shifted in favour of the elite. Financial
elites used political clout to cut taxes, dismantle social welfare & liberalize labour markets, reduce the
power of labour unions7 & deregulate the financial industry.
Course = how this shift happened. Shift to neoliberalism: set of policies grounded in neoclassical
economic theory aimed at maximizing role of markets in allocation of economic resources & reducing
role of state to principal enforces of ‘market efficiency’ in the economy. = tried to undo Keynesian
compromises (after 30s: consensus for need of state intervention) of post-war era of egalitarian
capitalism through marketization (e.g. lifting restrictions on international economic transactions.
Keynesian consensus unravelled during crisis of 1970s → giving rise to neoliberal turn.
5 the property of society getting the most it can from its scarce resources
6
a situation in which supply and demand have been brought into balance
7 a worker association that bargains with employers over wages and working conditions; also called “trade union”
or “labor union”
2
,This course/book: from 1980s will look at neoliberal transformations in 4 policy domains which fuelled
economic inequality & financial instability:
1) macroeconomic policy: tools of government to manage the business cycle, fight unemployment
during economic recessions8 and maintain price stability.
2) social policy & industrial relations: the organization of the welfare state & labour market.
3) corporate governance: formal & informal rules on shaping business strategies and the distribution
of profits 9between stakeholders (i.e. shareholders, managers, workers)
4) financial policy: regulation of the banking & credit system.
Changes will be analysed from a growth model perspective: linking the crisis to the formation of 2
mutually dependent but unsustainable growth models:
1) Anglo-Saxon liberal market economies (LMEs) + Southern EU mixed market economies (MMEs). =
debt-led.
2) North + West EU coordinated market economies (CMEs) = export-led.
→ development of these growth models was deeply connected to distinctive patterns of income and
wealth inequality in these advanced capitalist countries.
➔ read page 7-11 to read summary of entire course.
1 RISING INEQUALITY IN ADVANCED
CAPITALISM
S9: Measures on inequality in advanced capitalist countries:
1) measures of personal income distribution = Gini index = shares of different groups in national income
2) measures of functional income distribution = labour and capital share in national income
3) measures of wealth distribution.
➔ in all: can see how there’s extreme rise in inequality, BUT significant cross-national differences in
terms of 1) level of inequality & 2) evolution of inequality since 80s (=LMEs higher inequality > CMEs).
WHY? → neoclassic assert it’s because exogenous market forces (e.g. globalization) BUT: advanced
capitalist economies have been exposed to same market forces SO WHY: Anglo-Saxon LME’s > CMEs?
Political economy: globalization & technological change = definitely a factor BUT many other factors →
what we’ll learn.
Focus: political & social effects of excessive inequality; e.g. financial instability (e.g. in 2008, inequality
was a structural cause behind this instability.
We’ll research this through heterodox political economy.
MEASURES OF ECONOMIC INEQUALITY
PERSONAL INCOME DISTRIBUTION
Before Piketty, the most common way to measure inequality was the Gini-index: is an abstract measure:
ranges from 0 (everyone has same income) to 1 (complete inequality: no one earns anything except for
8 a period of declining GDP, real incomes and rising unemployment
9 total revenue minus total cost
3
, 1 household/individual). Measures the extent to which the actual distribution of disposable household
income deviates from the situation in which every household has the same income.
To understand: need Lorenz curve: = the cumulative % of households (from poor to rich) on the x-axis
& cumulative income share of these households on the y-axis.
S10: the x = going from poor 0% to rich 100%.
Y = national income = all the money that’s been earnt in 1 year in a particular country. calculates
disposable income after all taxes = paid. Its 2 main sources: 1) labour income = wages + 2) capital income
= money of banking account, investments10, real estate & its rent income.
The Lorenz curve: the actual income distribution in a country. The Gini index is a surface between A and
between A+B. So, the Gini index is a measure of the extent to which the actual income distribution
deviates from the line from perfect equality. So, if they match completely then the index is 0 and there’s
perfect equality.
To understand: https://www.youtube.com/watch?v=BwSB__Ugo1s
S11: the evolution of the Gini index between 1985-2008. Conclusion: income inequality tends to be
higher and also increasing quicker (compared to continental EU & Japan) in Anglo-Saxon countries: e.g.
US & UK. E.g. Sweden & Finland also increased highly, but they started from a lower level.
SO; all increased but still great cross-national differences. Partly goal of this course is to explain these
differences.
BUT: Gini index = vague/abstract = summarizes the entire income distribution in 1 single nr → SO: look
at national income shares of different groups & how they have evolved over the years. = shares of
different income groups in the total income that’s earned each year in a certain country and how shares
have evolved over time. → What Piketty & colleagues have done: focused mostly at the top 1%.
S12: conclusions: 1) great difference in the 1%: Anglo-Saxon (U-Shape: between 1980 & 2012 = income
share in top 1% doubled) vs. rich OECD countries (L-shape). Anglo-Saxon economies: almost all money
in US goes to the top 1% = in that sense one of most unequal countries in the world. = U-shape in terms
of time.
Piketty has labelled this group as the dominant class: because even if they’re just 1 percent, they’re still
quite numerical. In the US that’s 2,5 million people who have the most power/influence on their country.
S13: continental EU + Japan = more L-shape pattern : no huge increase from the 1990s in contradiction
to the Anglo-Saxons.
S14: NEED to know this table well: didn’t concentrate well, check again if needed.
Don’t need to know exact numbers, but e.g. know this for MCQ’s that the income of the bottom 50%
of EU increased more than the bottom 50% of the US.
If looking at evolution of income shares of people in the bottom 50% (lower class) and the middle 40%
(middle class) we see cross-regional differences between 5th & 9th decile of the income distribution. →
table shows accumulated income growth rates in EU & NA from 1980-2016 for these income groups:
real national income growth per adult (=income growth adjusted for inflation11) in this period reached
40% in EU and 63% in NA (=US & Canada).
1. Both regions: income growth = systematically higher for upper groups
2. BUT EU: growth gap between 1) bottom 50% & full population + 2) bottom 50% & top income
groups = lower
3. Top 1%: US = 35% of total growth EU = 18%. → double
4. Bottom 50%: US = 2% 14% → Shared more equally
5. US, the higher the hierarchy, the larger the inequality: already double shares in top 1%, 3x for
0,01% and 4x for 0,001. Top 0,1% in the US consists of 25,000 individuals. & the top 0,001%
only of 2500. = super elites. 600 billionaires in the US. I.e. these are really small groups.
10
spending on capital equipment (machinery), inventories, and structures, including household purchases of new
housing
11 an increase in the overall level of prices in the economy
4