To what extent is there evidence of inequality between Penn and Booker within High Wycombe? This coursework scored 56/60 (A*) in 2021, this coursework can be used as a guide of how to structure/complete an AQA NEA. This is 40 pages and includes everything needed such as statistical tests and vari...
To what extent is there evidence of inequality between
Penn and Booker within High Wycombe?
Introduction
Aims of the study
Inequality refers to the idea that different people experience different
standards of living, this can include income levels, access to services and
the environmental quality of an area (RGS, 2015).
The aim of this enquiry is to:
- To investigate whether there is inequality between two
neighbouring areas of High Wycombe, those areas being Penn and
Booker. This will be done by investigating types of inequality.
- The study will use various data collection techniques in the form of
surveys, questionnaires, and census data in order to see how the
different dimensions of inequality are evident between the areas.
- To identify any environmental differences in the areas through the
use of data in the forms of photographs, surveys and articles.
- To identify any socio-economic differences within the areas such as
the accessible services, income levels and house prices.
- To determine how wealth disparities within the two areas correlate
to social, economic, and environmental inequalities.
Research questions
To what extent is there evidence of inequality between Penn and
Booker within High Wycombe?
Investigating inequality between Penn and Booker will allow deeper
exploration into the different aspects of inequality, those being the social,
economic, and environmental. The study will assess multiple topics which
are covered in the geography specification and therefore this study will be
underpinned with knowledge gathered over the duration of the course,
such as content from ‘contemporary urban environments.
Whilst there may be evidence of inequalities in some aspects such as
economic inequality, it is possible that between the areas, there is
minimal social or environmental inequality. Splitting up the question into
two subtopics allows an in-depth investigation as to how unequal the
areas may be and also what those inequalities are or how in some ways,
the areas might appear to be very similar.
The primary question has been split into two sub-questions concerning the
socio-economic and environmental variations between the two areas. The
two questions will aid in addressing the overarching question in as much
depth as possible.
The main question for the investigation has been narrowed down
into sub-questions:
1. Is there evidence of socio-economic inequality between the
areas?
1
,The first sub-question covers the largest component of the investigation
and will give an effective insight into the inequalities between Penn and
Booker. This will include data such as house prices, local amenities,
ethnicity, jobs, and local businesses, all of which fall under the socio-
economic category of inequality. This study will look at how all these
factors vary within the two areas and how this, therefore, indicates
varying levels of deprivation. Due to the fact that inequality can present
itself in different ways, the data can be collected in a variety of different
forms in order to get a comprehensive response to the primary question.
2. Is there evidence of environmental inequality between the
areas?
Environmental inequality is another key area to investigate and can
present itself differently from socio-economic inequalities. The data will be
analysed through a variety of methods and collected via a range of
surveys that can look into different environmental problems. This could
include run-down areas, dereliction, homelessness, noise pollution and
cleanliness. Analysing litter, graffiti, and the quality of the area will
present evident physical inequalities within the two places. There is often
a link between the economic factors of the areas such as income levels or
house prices with the environmental quality.
Links to specification
3.2.3.2 This investigation links to the urban forms section of the
specification. Urban forms are defined as the physical characteristics that
make up built-up areas, including the shape, size, density, and
configuration of settlements. Through the investigation, the building
types, and services within the two contrasting areas will be analysed as
well as their urban characteristics, another part of the course
specification.
The physical and human factors of the places will be studied by looking at
social and environmental inequality. Furthermore, any signs of economic
inequality and social segregation in the different areas will be evaluated,
another area of the course specification.
3.2.3.3 Social and economic issues associated with urbanisation such as
the extent to which varying levels of wealth has affected the areas of
Penn and Booker. In particular, it will focus on the levels of inequality
evident in the population, the environment, the infrastructure, and the
businesses in the area.
3.2.3.7 Environmental problems in contrasting urban areas. This study
will consider environmental issues like noise pollution, vandalism and
littering and collect data through the form of surveys such as an
environmental quality survey.
Why Penn and Booker?
These places were selected due to their proximity to each other as well as
their accessibility. These places were both similar in size which made it
2
,easier to collect data that can be comparable. Penn and Booker’s location
as suburbs to High Wycombe means that they should show similarities as
well as evident differences. This will ensure that any inequalities between
the area will be visible. High Wycombe is known for evident wealth
disparities which was clear from completing a literature review and
therefore these two places tied in with the theme of the investigation
which was inequality between two areas.
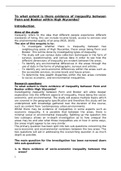
Location of the study
Figures 1 and 2 show the location of High Wycombe on= google
Source a mapmaps
of the
1 2
United Kingdom. The area of High Wycombe is located in Southeast
England, roughly 30 miles from London. It is located within the county of
Buckinghamshire. The two areas of Booker and Penn are located within
High Wycombe. Its coordinates are 51.6286° N, 0.7482° W. The
population is 92,000 and the area is run by Buckinghamshire County
council. Both data collection points are in the ‘suburbs’ of High Wycombe.
3
3
, Figure 3 shows that the areas are located within High Wycombe and are
close by – only 6.1 miles. This will mean they are both reachable and can
demonstrate how wealth can change dramatically in a short distance.
Penn (figure D) Source = ONS maps and Digi maps
4
Penn is a village located East within High Wycombe at the points 51.6412°
N, 0.7082° W. It is also commonly known as ‘Penn and Tyler’s Green’. The
village has a population of 4,169 and is roughly 16km 2. It is a popular
residential area with amenities such as a pond, shops, various businesses,
a church and two schools in the centre.
Booker (figure 4)
5
Booker is a hamlet in the Parish of West Wycombe, included in the High
Wycombe Ward of Booker and Cressex. It has a population of 4771. It is a
mainly residential area consisting of estates whilst also including a range
of businesses and being known for its local airfield, more properly known
as Wycombe Air Park, one of the busiest general aviation airfields in the
Southeast of England. Booker is seen in figure 5.
4
Les avantages d'acheter des résumés chez Stuvia:
Qualité garantie par les avis des clients
Les clients de Stuvia ont évalués plus de 700 000 résumés. C'est comme ça que vous savez que vous achetez les meilleurs documents.
L’achat facile et rapide
Vous pouvez payer rapidement avec iDeal, carte de crédit ou Stuvia-crédit pour les résumés. Il n'y a pas d'adhésion nécessaire.
Focus sur l’essentiel
Vos camarades écrivent eux-mêmes les notes d’étude, c’est pourquoi les documents sont toujours fiables et à jour. Cela garantit que vous arrivez rapidement au coeur du matériel.
Foire aux questions
Qu'est-ce que j'obtiens en achetant ce document ?
Vous obtenez un PDF, disponible immédiatement après votre achat. Le document acheté est accessible à tout moment, n'importe où et indéfiniment via votre profil.
Garantie de remboursement : comment ça marche ?
Notre garantie de satisfaction garantit que vous trouverez toujours un document d'étude qui vous convient. Vous remplissez un formulaire et notre équipe du service client s'occupe du reste.
Auprès de qui est-ce que j'achète ce résumé ?
Stuvia est une place de marché. Alors, vous n'achetez donc pas ce document chez nous, mais auprès du vendeur oliviawoolley10. Stuvia facilite les paiements au vendeur.
Est-ce que j'aurai un abonnement?
Non, vous n'achetez ce résumé que pour €15,47. Vous n'êtes lié à rien après votre achat.