Summary of the material for the final SPSS exam (2022) for Statistics II: Applied Quantitative Analysis. INCLUDES a cheat sheet of the course’s general information, SPSS commands and functions (Total: 35 pages).
Thank you for the review! I hope the notes helped.
Par: marawankhalil1 • 2 année de cela
Par: giacomoef • 2 année de cela
Thanks for the review! I hope the notes helped.
Par: benjaminkester • 2 année de cela
Par: giacomoef • 2 année de cela
Thank you! I hope the exams go well!
Par: julesmurray01 • 1 année de cela
Par: giacomoef • 1 année de cela
Thanks for the review!
Par: julesmurray01 • 1 année de cela
You are welcome!
Par: eviwijnhoven • 2 année de cela
Par: giacomoef • 2 année de cela
Thank you for the review! Good luck with the exams!
Afficher plus de commentaires
Vendeur
S'abonner
giacomoef
Avis reçus
Aperçu du contenu
Summary of the material for the final SPSS exam (2022) for Statistics II: Applied Quantitative
Analysis. INCLUDES a cheat sheet of the course’s general information, SPSS commands and
functions (Total: 35 pages).
1
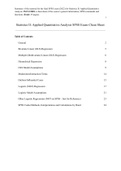
Other Logistic Regressions (NOT on SPSS - Just for Reference) 23
SPSS Codes/Methods, Interpretations and Calculations by Hand 24
, 2
General
Variables in Models:
1. Dependent Variable (DV): The variable we want to predict/explain/understand (i.e.
outcome variable, Y).
2. Independent Variable (DV): The variable we are using to predict/explain the outcome (i.e.
predictor variable, X).
Statistical Models:
1. Ordinary Least Squares (OLS): Models continuous (scale) DVs, with a variety of different
IVs.
2. Logit Models: Models binary (two) outcome variables.
3. Multinomial and Ordered/Ordinal Logit Models: Models categorical (multiple categories)
and ordinal dependent variables.
Interpretations:
1. Do NOT interpret the slope coefficient as saying something about the constant.
➔ The constant gives the mean value of the DV when X=0.
➔ The slope for an IV tells us how Y changes on average for each one-unit increase in
X.
2. Include statistics + p-value + significance.
Levels of Measurement:
● Categorical: Contain a finite number of categories or distinct groups.
1. Nominal:
■ 2+ exclusive categories, with NO natural order.
■ NO arithmetic operations are possible (subtraction or logical operations).
■ Can only talk about these categories in frequency (mode).
■ E.g. political party affiliation.
2. Ordinal:
■ Clear ordering of the values (e.g. small or larger).
■ Spacing between the values is NOT the same across levels.
■ Comparison is possible, but only relative.
■ E.g. level of agreement.
■ IMPORTANT: If there is an ordinal variable choose between treating it as:
● Categorical (if told: “treat the variable as ‘ordinal’”):
○ Pick a category to serve as the reference/baseline and enter
dummy variables for the other categories.
○ Advantage = does NOT require any supplemental assumptions
to interpret the coefficients and is therefore easy to justify
(difference in means test).
○ Disadvantage = information about the variable is discarded
(i.e. it’s ordering), which can be more difficult to show and
discuss.
● Continuous (if told: “treat the variable as ‘interval/ratio’”):
○ Same interpretation as the continuous predictor.
○ Advantages = retains the ordering information, easy to
interpret and in nearly all cases does NOT affect conclusions
because the relationships are approximately linear enough.
○ Disadvantages = assumption can fail (inaccurate assessment),
, 3
and the assumption that each increment in X is equally spaced
is forced to be made, which may be more controversial.
● Continuous: Numeric variables that have an infinite number of values between any two
values (i.e. the difference = meaningful).
➔ Variables can be continuous, OR discrete:
◆ “Continuous”: Measured to any level of precision (e.g. height can be
measured to any value).
◆ “Discrete”: Only takes certain, countable values, usually whole numbers
(e.g. points in an exam).
➔ Interval/ratio variables are categorised together in SPSS.
3. Interval:
■ 0 = arbitrary or meaningless.
■ E.g. a temperature of 0.0°C to °F does not mean ‘no heat’.
4. Ratio:
■ Like interval variables, but have a meaningful 0.
■ E.g. 0 Kelvin means no heat.
Data Cleaning/Descriptive Statistics:
1. Investigate variables.
2. For completeness always run a frequency table before.
➔ Creating a frequency table = Analyse → Descriptive Statistics → Frequencies
3. Always inspect how missing variables are coded.
4. Recode variables into dummies (do NOT forget SYSMIS and add value labels).
➔ (Transform → Recode into Different Variables), always ADD variable labels (e.g.
0=bicameral, 1=unicameral).
5. Look at SPSS’ output.
Minimum/Maximum Values (of the Sample):
● Finding = data view, right-click on the variable name and sort ascending/descending.
● When asked to determine the magnitude of a relationship → minimum and maximum
and compare.
● Predicting:
1. Write down the formula.
2. Determine the variable observed minimum and maximum.
3. Determine the mode/mean for other variables in the formula that remain constant.
4. Fill all values into the model.
Binary/Dichotomous/“Dummy”: Variables that can take on one of two variables (typically 0 or 1),
talks about a difference in means test.
➔ When analysing/recoding different types of variables:
◆ Categorical = use mode (when running dummy variables, exclude one category
from the analyses ⇒ becomes included in the constant).
● Constant represents the number if all X variables = 0 (i.e. excluded
category).
◆ Continuous = use means.
, 4
Creating Dummy Variables:
1. Create a series of binary or dummy variables for each category (1 = member of that
category, 0 = member of one of the other categories).
2. When choosing a reference category, considerations can be:
● Theoretical; choose the category most expected to deviate from the others.
● Practical; choose the category with a large number of observations.
➔ Do NOT use a category with few observations, as resulting estimates will
be imprecise.
3. Include all but one (the reference/baseline category) of these dummy variables in the
model, against which the others will be compared.
➔ Constant Term: The expected value of the DV when the IVs = 0. In a bivariate
model, the constant = the average for cases in the reference category (e.g. Labour).
➔ Coefficient for Categories: The difference in means between category and
reference group holding the remaining variables constant.
Statistical Significance:
● Statistical significance (precision) ≠ Substantive importance/significance (size).
➔ More data = less uncertainty (generally).
➔ A “null” effect can be practically/socially important.
● Null hypothesis = NO relationship; an increase in X does NOT = increase in Y (just a
straight line).
If you see: What it means: Write p-value as: Interpretation:
.000 p = 0.000… p < 0.001 Reject H0.
.001 p = 0.001 p <0.01 or p <0.05, depends on the threshold value. Reject H0.
< 0.001 0.0005 < p <0.001 p <0.001 Reject H0.
.061 p = 0.061 p = 0.061 or p <0.01 or p <0.05, depends on the Do NOT reject H0.
threshold value.
Missing Values:
1. System Missing (SYSMIS = SYSMIS): Data is missing in
the values boxes; a blank cell. Nothing needs to be done.
2. User-Defined Missing Variable (MISSING = SYSMIS): A
specific numeric value for missing data. Usually, holding
a negative/extreme value (look at the Values column in
SPSS or create a frequency table).
➔ CAUTION: Ensure variables are coded as a specific number (value label
column).
➔ Write if numbers were added to the Missing Column.
Les avantages d'acheter des résumés chez Stuvia:
Qualité garantie par les avis des clients
Les clients de Stuvia ont évalués plus de 700 000 résumés. C'est comme ça que vous savez que vous achetez les meilleurs documents.
L’achat facile et rapide
Vous pouvez payer rapidement avec iDeal, carte de crédit ou Stuvia-crédit pour les résumés. Il n'y a pas d'adhésion nécessaire.
Focus sur l’essentiel
Vos camarades écrivent eux-mêmes les notes d’étude, c’est pourquoi les documents sont toujours fiables et à jour. Cela garantit que vous arrivez rapidement au coeur du matériel.
Foire aux questions
Qu'est-ce que j'obtiens en achetant ce document ?
Vous obtenez un PDF, disponible immédiatement après votre achat. Le document acheté est accessible à tout moment, n'importe où et indéfiniment via votre profil.
Garantie de remboursement : comment ça marche ?
Notre garantie de satisfaction garantit que vous trouverez toujours un document d'étude qui vous convient. Vous remplissez un formulaire et notre équipe du service client s'occupe du reste.
Auprès de qui est-ce que j'achète ce résumé ?
Stuvia est une place de marché. Alors, vous n'achetez donc pas ce document chez nous, mais auprès du vendeur giacomoef. Stuvia facilite les paiements au vendeur.
Est-ce que j'aurai un abonnement?
Non, vous n'achetez ce résumé que pour €9,99. Vous n'êtes lié à rien après votre achat.