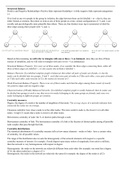
Structural Balance
Positive and Negative Relationships: Positive links represent friendship (+) while negative links represent antagonism
(-).
If we look at any two people in the group in isolation, the edge between them can be labelled + or -; that is, they are
either friends or enemies. But when we look at sets of three people at a time, certain configurations of +'s and -'s are
socially and psychologically more plausible than others. There are four distinct ways (up to symmetry) to label the
three edges among three people with +'s and -'s.
Based on this reasoning, we will refer to triangles with one or three +'s as balanced, since they are free of these
sources of instability, and we will refer to triangles with zero or two +'s as unbalanced.
Structural Balance Property: For every set of three nodes, if we consider the three edges connecting them, either all
three of these edges are labelled +, or else exactly one of them is labelled +.
Balance Theorem: If a labelled complete graph is balanced, then either all pairs of nodes are friends, or else the
nodes can be divided into two groups, X and Y , such that every pair of nodes in X like each other, every pair of nodes
in Y like each other, and everyone in X is the enemy of everyone in Y .
Weak Structural Balance Property: There is no set of three nodes such that the edges among them consist of exactly
two positive edges and one negative edge.
Characterization of Weakly Balanced Networks: If a labelled complete graph is weakly balanced, then its nodes can
be divided into groups in such a way that every two nodes belonging to the same group are friends, and every two
nodes belonging to different groups are enemies.
Centrality measures
Degree: the degree of a node is the number of neighbors of that node. The average degree of a network indicates how
connected the nodes are on average.
Closeness centrality: how close a node is to the other nodes. The more central a node is, the closer it is to all other
nodes. A high CC means that a node is closer to all other nodes.
Betweenness centrality of node: the % of shortest paths through a node.
Betweenness centrality of link: The betweenness centrality of a link is the fraction of shortest paths among all possible
node couples that pass through that link.
Centrality distributions
The statistical distribution of a centrality measure tells us how many elements – nodes or links - have a certain value
of centrality, for all possible values.
The range of the distribution also reveals the heterogeneity of the network elements with respect to a specific
centrality measure of interest: for example, if node degrees span many orders of magnitude, from units to millions,
then the network is very heterogeneous with respect to degree.
Heterogeneity: the nodes in the network are relatively different from each other (for example: one node has a degree
of 10, the other nodes have a degree of 1)
Homogeneity: the nodes in the network are relatively the same (for example: the degree of the nodes is all 2)
, The Friendship Paradox
The Friendship Paradox: your friends have more friends than you do, on average. This is due to the high probability
of selecting hubs among a node's neighbors.
It is easier to find people through their friend than by random search: if someone has many friends, she has a far
greater chance of being mentioned by someone than if she had just a few .
Reaching out to someone's friends actually means choosing links instead of nodes. When we go for the nodes, each of
them has the same probability of being selected, regardless of their degree. When we go for the links, the larger the
number of neighbors of a node, the higher the probability it will be reached.
The chances of hitting a hub increase if you move from the circle of neighbors to that of the neighbors of neighbors,
and so on. This is because the number of links to follow increases at each step, so it becomes more likely that one of
them is attached to a hub.
Ultra-Small Worlds
The hubs of a network are not only easy to find, as we have just seen; they are also in great
demand. For example: if you want to fly from A to B but there is no direct flight, you have to make at least one
connection at airport C. (like London or New York)
Networks with broad degree distributions often have the so-called ultra-small world property, indicating that the
distances between nodes are very short.
Robustness
A system is robust if the failure of some of its components does not affect its function. For example, an airplane
where an engine has failed can still fly, but if you take away the wings, it can’t function anymore.
You can define the robustness of a network by looking at how the removal of a node and its links affects the
connectedness of the system. If the system remains connected, we can assume that it will keep working fine, to some
extent. However, a breakup of the network into disconnected pieces would signal severe damage that might
compromise its function.
The standard robustness test for networks consists of checking how the connectedness is affected as more and more
nodes are removed, along with all their adjacent links. To estimate the amount of disruption following node removal,
scholars compute the relative size of the giant component.
1. The initial network is connected. In this case the giant component coincides with the whole network, so its relative
size is one.
2. If the removal of a subset of nodes does not break it into disconnected pieces, the proportion of nodes in the giant
component just decreases by the fraction of removed nodes.
3. If, however, the node removal breaks the network into two or more connected components, the size of the giant
component may drop substantially.
Core Decomposition
When analysing or visualizing a large network, it is often useful to focus on its denser portion (core). The degree of
each node can be used to separate a network into distinct portions, called shells, based on their position in the core-
periphery structure of the network. As they are removed, or peeled away, what remains is a denser and denser inner
subnetwork, the core. We start with singletons (zero-degree nodes), if there are any. Then we remove all nodes with
degree one. Once there are none left, we start removing nodes with degree two, and so on. The last group of nodes to
be removed is the innermost core.
PageRank
PageRank is an algorithm, or procedure, to compute a centrality measure
that aims to capture the prestige or importance of each node; it is typically
used in directed networks. Google uses PageRank to mark pages important
and to get them higher in the search results. A page gets a higher
PageRank if there are more links from other pages where the number of
links on those other pages and the PageRank of those other pages are
also important.
Les avantages d'acheter des résumés chez Stuvia:
Qualité garantie par les avis des clients
Les clients de Stuvia ont évalués plus de 700 000 résumés. C'est comme ça que vous savez que vous achetez les meilleurs documents.
L’achat facile et rapide
Vous pouvez payer rapidement avec iDeal, carte de crédit ou Stuvia-crédit pour les résumés. Il n'y a pas d'adhésion nécessaire.
Focus sur l’essentiel
Vos camarades écrivent eux-mêmes les notes d’étude, c’est pourquoi les documents sont toujours fiables et à jour. Cela garantit que vous arrivez rapidement au coeur du matériel.
Foire aux questions
Qu'est-ce que j'obtiens en achetant ce document ?
Vous obtenez un PDF, disponible immédiatement après votre achat. Le document acheté est accessible à tout moment, n'importe où et indéfiniment via votre profil.
Garantie de remboursement : comment ça marche ?
Notre garantie de satisfaction garantit que vous trouverez toujours un document d'étude qui vous convient. Vous remplissez un formulaire et notre équipe du service client s'occupe du reste.
Auprès de qui est-ce que j'achète ce résumé ?
Stuvia est une place de marché. Alors, vous n'achetez donc pas ce document chez nous, mais auprès du vendeur matthiaslouws. Stuvia facilite les paiements au vendeur.
Est-ce que j'aurai un abonnement?
Non, vous n'achetez ce résumé que pour €5,99. Vous n'êtes lié à rien après votre achat.