This summary is a combination of the slides, my personal notes and sometimes extra information taken from the book in order to have a more in depth understanding.
I watched every class recording twice in order to get every information needed and especially the explanation of the graphs since the...
Maths plays an important role in economic so it’s seen as a technical course but we will keep maths at a minimum
and it’s easy to understand
I- WHAT IS (COMPARATIVE) POLITICAL ECONOMY?
• As an interdisciplinary subfield in social sciences, political economy studies the interaction between
political/social and economic dynamics
• Application of Laswell’s definition of politics – “Who gets what, when and how”? – to the economy
• Interaction can be studied in two different angles:
1. Impact of political/social events on the economy →political economists: we should also look at politics to find the
causes of an economic crisis: how to politics influence the economy?
• Global financial crisis 2008 →unemployment, poverty, income inequality,…
➔ Biggest in history bcs European and American banks were at risk
• Rising inequality in the western world
→problematic consequences for politicians that want to have less problems to remain in power
Why do these financial crises occur? Why is a capitalist system prone to eco instability?
→meanstream eco (neoclassical economics) causes of financial crises seen in a different way so in contrast to
them political economits believe that it’s impossible to understand the true causes without taking into account
politics (power of banks, influence of banks on gov,...) →regulated the financial sector from the 80s onwards: means
that they removed all kinds of regulation that before prohibited banks to invest our money into risky financial
products or into foreign countries →by abolishing these rules: banks took more risks to maximize their profits → too
much credit in households and created bubbles
Important question in pol economy: why did the western gov liberalize the financial system? How can we explain the
influence of the financial sec to put pressure on our gov?
2.Impact of economic events on politics and society
• Rise in populism
In political economy it is impossible to understand
the rise of pop parties without taking into account
economy (rise of economic insecurity linked to
globalization or industrialization,..)
Since 1990S
1
, ❖ Election donal trump
Graphs that suggest that the election of trump has an important economic cause →exposed the communities to the
chinese competition: vulnerable job looses as result of the trade with china
→The same region where trump won the election →Voters considered trump more attractuve Trump:represented
the status quo + his xenophobia + trump balmed china with destroying jobs
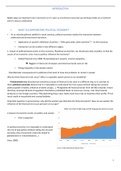
Graphs that summarizes the entire course
→graph on the american economy
Correlation between income inequality
and financial instability
Due to the crisis Great depression reforms
lead to more stable economic system
btwn 30-80s : declining income inequality
70s: other crisis: beginning of all liberal
reforms →result: system has become
more unstable + increase in income
inequality
Causal relationship btwn income
inequality and financial instabiliy that can’t
be seen here but is proven later
After the Great Depression, rich democratic countries experienced a threefold crisis (banking crisi, public finances, real
economy). The crises are connected to growing levels of income and wealth inequality across groups and classes where
the top 10% percent always own 40% of national income. America was more drastic than constant Europe.
II- MEASURES OF INEQUALITY
• Gini-index van disposable income inequality
• Most often-used measure of inequality before Thomas Piketty’s Capital in the 21st Century (2014)
→fueling the debate of inequality: measures it in a concrete way:
• Share of different income groups (e.g. “top 1 %”) in national income
• Data of Thomas Piketty and colleagues → measure income inequality with diff income shares
• Share of labor versus capital in national income (GDP)
• Wealth inequality: Share of different wealth groups (e.g. “top 1%”) in national wealth
2
, A) Gini-index
Before Piketty: Gini index was used
Abstract measure from 0 (=complete equality) to 1 (income inequality)
National income share of the groups from low to high
The bottom (20%) : only 5% of national income , the high: 55% of national
income
National income= Labour income (wages) and capital income (like money,
financial investments in stocks or bonds, real estate,...) = all income earned in
one year in one particular country
Lorenz curve: actual income distribution →interplay between cumulative % of
households and the income share of these households
Gini-coeff: ration btwn A and (A+B) = measures the actual income distribution deviaties form the line of perfect
equality → if 0: perfect equality
Problems with the Gini-Coefficient include:
1. Underestimation of the degree of income: household survey cannot correctly capture the income of those at the
top
2. Overly abstract view of inequality:difficult to understand someone’s position in the income distribution
Therefore it’s more usefull to look at the national income shares and see how they evolved → Pikkety
3. hard to tell what is happening and what it means when the Gini-coefficient increases, so distribution tables are
more reliable which show changes over time
→ income inequality is higher in the anglo-
saxon eco (UK, USA) and has also increased
faster there
Some continential eu: exception (sweden and
finland ) started from a low level of inequality
and increased fast
Almost a universal increase of income
inequality BUT differences in the level of
inequality and the extent of which it increased
Objective: explain the difference btwn the countries
B) Piketty and Sez
Another way to measure was developed by Piketty and Sez → used tax records to trace back levels of inequality for
over two centuries.
They were particularly focused on the top 1%”dominant class” →their income reflects national inequality - showing
large incomes - but also points to the amount of people who benefit from it, and on an even smaller scale, the super-
elites.
3
, → 1% seems small BUT it still comprehends hundreds of thousands of
people who also have socio-political influence on their nation.
Anglo-Saxon eco: U shape
More than 20% of all the income in the US goes to the top 1% →US is the
most unequal country in the industrialized world
L shape
1% is a very small part of the pop so why is it relevant?
in absolute terms: they are numerically large groups → ex: US
2.50million adults →1% 2.5million American citizens
from 80s there has been some increase but not as much as in
the anglosaxon economies
How much income has grown btwn 80 and 2016 in EU and US
→average eu person: increase of 40%
Conclusion: income of the bottom 50% increased more in EU than
us (25 VS 5) and if we go in the top of the income distribution also
here the difference becomes obvious (EU 72 vs 206) and the
difference become larger the more we go higher (top 0.001%)
In EU: increase in income inequality →income of the top 1% has
been much higher but the difference isn’t as large as the anglo-
saxon economies
All the income that has been earned, what is the share that has
been caputred by the groups?
If the groups would have been shared equally, every income group would have had the equal amoutn of share (50%
for the bottom 50%, top 1% only 1%,..) but it’s not the case 32
#examquestion: how the income inequality has evolved since the 80s?
Top Group has received more income in capital than labour
Within the 10% there is an inequality: the 90%: labour income is
more important and income in capital is supplementary
Ex in belgium: montly net income is 4.000 euros per months net +
her appartment that she rents gives the person 1000 →Total income
would be 5.000 where 80 of labour and 20% of capital
95% of adults will earn less than 5.000 net income per month
Net income of 3.000/ month then you belong to the top 10% →most
people earn less (1500-2500 e/month)
4
Les avantages d'acheter des résumés chez Stuvia:
Qualité garantie par les avis des clients
Les clients de Stuvia ont évalués plus de 700 000 résumés. C'est comme ça que vous savez que vous achetez les meilleurs documents.
L’achat facile et rapide
Vous pouvez payer rapidement avec iDeal, carte de crédit ou Stuvia-crédit pour les résumés. Il n'y a pas d'adhésion nécessaire.
Focus sur l’essentiel
Vos camarades écrivent eux-mêmes les notes d’étude, c’est pourquoi les documents sont toujours fiables et à jour. Cela garantit que vous arrivez rapidement au coeur du matériel.
Foire aux questions
Qu'est-ce que j'obtiens en achetant ce document ?
Vous obtenez un PDF, disponible immédiatement après votre achat. Le document acheté est accessible à tout moment, n'importe où et indéfiniment via votre profil.
Garantie de remboursement : comment ça marche ?
Notre garantie de satisfaction garantit que vous trouverez toujours un document d'étude qui vous convient. Vous remplissez un formulaire et notre équipe du service client s'occupe du reste.
Auprès de qui est-ce que j'achète ce résumé ?
Stuvia est une place de marché. Alors, vous n'achetez donc pas ce document chez nous, mais auprès du vendeur ElisaBreyne. Stuvia facilite les paiements au vendeur.
Est-ce que j'aurai un abonnement?
Non, vous n'achetez ce résumé que pour €4,59. Vous n'êtes lié à rien après votre achat.