Samenvatting SPO - Statistische modellen 2 (Nederlands, boek: Statistiek in de praktijk)
77 vues 1 fois vendu
Cours
Statistische modellen 2 (PABA2058)
Établissement
Rijksuniversiteit Groningen (RuG)
Book
Statistiek in de praktijk Theorieboek
In deze samenvatting worden alle hoofdstukken van statistische modellen 2 behandeld in het Nederlands. Daarnaast heb ik ook de korte samenvattingen toegevoegd van het Engelse boek Statistical methods for the Social Sciences. Met deze samenvatting heb ik een 9,5 gehaald, dus ik hoop dat het jou ook ...
Boek: Statistical methods for the Social Sciences
Hoofdstuk 9: Lineair Regression and Correlation (46 pagina’s)
Methods for analyzing quantitative response and explanatory variables.
Regression analysis:
1. Association between the variables → hypothesis of statistical independence
2. Strength of their association → correlation
3. Regression equation → predicts value of the response variable form the value of the
explanatory variable.
9.1 Linear Relationships
Response variable y
Explanatory variable x
Linear function The formula y = α + βx expresses observations on y as a linear function of
observations on x. The formula has a straight line graph with slope β (beta)
and y-intercept α (alpha, constante → x=0)
Origin Where x=0 and y=0
y-intercept Where x=0, so only α
Slope β The change in y for a one-unit increase in x. (x=0 → x=1)
Coördinaten (x,y)
9.7 Chapter summary
Association between quantitative variables. A regression model to describe the form of the
relationship between the explanatory variable x and the mean E(y) of the response variable. The
major aspects of the analysis are as follows:
➢ The linear regression equation E(y) = α + βx describes the form of the relationship. This
equation is appropriate when a straight line approximates the relationship between x and
the mean of y.
➢ A scatterplot views the data and check whether the relationship is approximately linear. If it
is, the least squars estimates of the y-intercept α and the slope β provide the prediction
equation ^y = a + bx closest to the data in terms of a sum of squared residuals.
➢ The correlation r and its square describe the strength of the linear association. The
correlation is a standardized slope, having the same sighn as the slope but falling between -1
and +1. Its square r2, gives the proportional reduction in variability about the prediction
equation compared to the variability about ȳ.
➢ For inference about the relationship, a t test using the slope or correlation tests the null
hypothesis of independence, namely, that the population slope and correlation equal 0. A
confidence interval for the slope estimates the size of the effect.
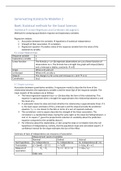
Summary of tests of independence ans measures of association
Measurement Levels of variables
Nominal Ordinal Interval
Null hypothesis H0: Independence H0: Independence H0: Independence (β = 0)
2 2
Test statistic χ = Som(f0 – fe) / fe z = ^y/SE t = b/se, df = n-2
Measure of 𝜋̂2 − 𝜋̂1 ^y = C – D / C + D r = b(sx / sy)
association
Odds ratio
, Hoofdstuk 11: (48 pagina’s)
11.9 Chapter Summary
This chapter generalized the bivariate regression model to include additional explanatory variables.
The multiple regression equation relating a response variable y to a set of k explanatory variables is:
E(y) = α + β1x1 + β2x2 + … βkxk
➢ The βi are partial regression coefficients. The value βi is the change in the mean of y for a
one-unit change in xi, controlling for the other variables in the model.
➢ The multiple correlation R describes the association between y and the collective set of
explanatory variables. It equals the correlation between the observed and predicted y-
values. It falls between 0 and 1.
➢ R2 = (TSS – SSE) / TSS represents the proportional reduction in error from predicting y using
the prediction equation ^y = a + b1x1 + b2x2 + … + bkxk instead of ȳ. It equals the square of the
multiple correlation.
➢ A partial correlation, such as ryx1*x2, describes the association between two variables,
controlling for others. It falls between -1 and +1.
➢ The squared partial correlation between y and xi represents the proportion of the variation in
y than can be explained by xi, out of that part left unexplained by a set of control variables.
➢ An F statistic tests H0: β1 = β2 = … = βk = 0, that the response variable is independent of all the
predictors. A small P-value suggests that at least one predictor affects the response.
➢ Individual t tests and confidence intervals for {βi} analyze partial effects of each predictor,
controlling for the other variables in the model.
➢ Interaction between x1 and x2 in their effects on y means that the effect of either predictor
changes as the value of the other predictors changes. We can allow this by introducing cross-
products of explanatory variables to the model, such as the term β3(x1x2).
➢ To compare regression models, a complete model and a simpler reduced model, the F-test
compares the SSE values or R2-values.
➢ Standardized regression coefficients do not depend on the units of measurement. The
estimates standardized coefficient b*I describes the change in y, in y standard deviation
units, for a one-standard-deviation increase in xi, controlling for the other explanatory
variables.
Bivariate regression Multiple regression
Model Prediction E(y) = α + βx E(y) = α + β1x1 + β2x2 + … βkxk
equation ^y = a + bx ^y = a + b1x1 + b2x2 + … + bkxk
Simultaneous effect of x1 …, xk Partial effect of one xi
b = Slope
bi = partial slope
r = correlation,
R = Multiple correlation, 0 ≤ R ≤ b*I = standardizes
standardized slope,
Properties of 1 regression coefficient
-1 ≤ r ≤ 1 2
measures R = PRE measure, Partial correlation,
r has the same sign as b
0 ≤ R2+ ≤ 1 -1 ≤ ryx1*x2 ≤ 1,
r2 = PRE measure,
Same sign as bi and b*I,
0 ≤ r2 ≤ 1
H0: βi = 0, or H0: popul,
partial corr. = 0.
Test of no H0: β = 0 or H0: ρ = 0, H0: β1 = …. = βk = 0
y not associated with xi,
association y not associated with x (y not associated with x1, …, xk)
controlling for other x
variables
F = Regression MS / Residual MS
t = b/SE = r / wortel((1-
= (R2/k)/(1-R2)/[n-(k+1)] t = bi / SE
Test statistic r2)/n-2)
Df1 = k df = n – (k + 1)
df = n-2
Df2 = n – (k + 1)
,Hoofdstuk 12 (44 pagina’s)
12.9 Chapter Summary
Anlaysis of variance (ANOVA) methods for comparing several groups according to their means on a
quantitative response variable. The groups are categories of one or more categorical explanatory
variables.
➢ One-way ANOVA methods compare means for categories of a single explanatory variable.
➢ Two-way ANOVA methods compare means across categories for each of two explanatory
variables. Assuming no interaction, the mean effects describe the effect of each predictor
while controlling for the other one.
➢ Multiple comparison methods provide confidence intervals for the difference between each
pair of means, while controlling the overall error probability. The Bonferroni method does
this using an error probability for each comparison that equals the desired overall error
probability divided by the number of comparisons.
➢ Analysis-of-variance methods are special cases of multiple regression analyses. Dummy
variables in the regression model represent categories that define the groups. Each dummy
variable equals 1 for a particular category and 0 otherwise.
Ordinary ANOVA methods compare groups with independent random samples, from the groups. For
some studies, different samples instead have the same subjects, such as when an experiment
observes subjects repeatedly over time. Methods for repeated measures ANOVA result from
regression models with random effects that represent the effect of the random sample of observed
subjects. Such methods treat within-subjects effects (for repeated measurements on subjects)
differently from between-subjects effects (for independent samples of subjects).
This chapter has modelled a quantitative response variable as a function of a categorical explanatory
variables.
ANOVA tests for comparing Several Groups on a Response variable:
Element of Test One-way ANOVA Two-way ANOVA Repeated Measures
ANOVA
1. Samples Independent Independent Dependent
2. Hypotheses H0: identical means H0: identical row H0: identical means
Ha :at least two means means Ha: at least two means
not equal H0: identical col. not equal
Means
H0: no interaction
3. Test statistic F = (Between-groups MS) F = Effect MS / MS F = Effect MS / MS
/ (Within-groups MS) error error
F = distribution F = distribution F = distribution
Df1 = g – 1 Df1 = df for effect Df1 = df for effect
Df2 = N – g Df2 = df for error Df2 = df for error
4. P-value Right-tail probability Right-tail probability Right-tail probability
Hoofdstuk 13 (29 pagina’s)
Controlling for a Covariate:
➢ One-way ANOVA: compares the mean of the response variable for several groups.
➢ Two-way ANOVA: compares means while controlling for another categorical variable.
o Quantitative control variable = covariate
▪ Comparison for this type of regression = analysis of covariance
, 13.1 Comparing means and comparing regression lines
Quantitative explanatory variable by x and a categorical explanatory variable by z
➢ When categorical predictor has 2 categories → z = dummy-variable
o Several categories → set of dummy-variable
Comparing Regression Lines
Studying the effect on x on y while controlling for z is equivalent to analyzing the regression of y on x
separately for new and older homes.
➢ No interaction → true slop of the line relating expected selling price to the size of home is
the same for new and older homes
o Lines are parallel
▪ Y-intercepts also equal → regression lines coincide
➢ Interaction → if the rate of increase in selling price as a function of size of home differed for
new and existing homes, then the two regression lines would not be parallel.
Comparing Means on y, Controlling for x
To study whether the difference in mean incomes can be explained (between man and woman) by
differing experience levels of men and women, we compare mean incomes for men and women
having equal levels of experience.
➢ No interaction → lines are parallel
o The difference between mean incomes for men and women is identical for all fixed
values of x = number of years of experience.
➢ Same line → mean income is identical at each level of experience.
➢ Interaction → regression lines are not parallel
o Mean income for men is higher than the mean income for women at all experience
levels, and the difference increases as experience increases.
Les avantages d'acheter des résumés chez Stuvia:
Qualité garantie par les avis des clients
Les clients de Stuvia ont évalués plus de 700 000 résumés. C'est comme ça que vous savez que vous achetez les meilleurs documents.
L’achat facile et rapide
Vous pouvez payer rapidement avec iDeal, carte de crédit ou Stuvia-crédit pour les résumés. Il n'y a pas d'adhésion nécessaire.
Focus sur l’essentiel
Vos camarades écrivent eux-mêmes les notes d’étude, c’est pourquoi les documents sont toujours fiables et à jour. Cela garantit que vous arrivez rapidement au coeur du matériel.
Foire aux questions
Qu'est-ce que j'obtiens en achetant ce document ?
Vous obtenez un PDF, disponible immédiatement après votre achat. Le document acheté est accessible à tout moment, n'importe où et indéfiniment via votre profil.
Garantie de remboursement : comment ça marche ?
Notre garantie de satisfaction garantit que vous trouverez toujours un document d'étude qui vous convient. Vous remplissez un formulaire et notre équipe du service client s'occupe du reste.
Auprès de qui est-ce que j'achète ce résumé ?
Stuvia est une place de marché. Alors, vous n'achetez donc pas ce document chez nous, mais auprès du vendeur tesswigink1. Stuvia facilite les paiements au vendeur.
Est-ce que j'aurai un abonnement?
Non, vous n'achetez ce résumé que pour €10,51. Vous n'êtes lié à rien après votre achat.