Basic Concepts
1 PURPOSE REGRESSION ANALYSIS
Regression analysis is concerned with the study of the dependence of one variable, the dependent
variable, on one or plural variables, the explanatory variables, with a view to estimating and/or
predicting the population mean or average value of the former in terms of known or fixed (in
repeated sampling) values of the latter.
2 THE POPULATION REGRESSION FUNCTION (PRF)
The population regression curve = the locus of the conditional expectations of the dependent
variable for fixed values of the independent variable.
→In principle: population ∞ large, i.e. for each value of X we have an ∞ number of observations on Y
Mathematical specification: 𝐸(𝑌|𝑋𝑖 ) = 𝑓(𝑋𝑖 )
Linear population regression function (PRF): 𝐸(𝑌|𝑋𝑖 ) = 𝛽1 + 𝛽2 𝑋𝑖
2.1 INTERPRETATION ‘LINEAR’
Two alternative interpretations:
• Linear in the variables
o The conditional expectations of Y are a linear function of Xi
NOT: 𝐸(𝑌|𝑋𝑖 ) = 𝛽1 + 𝛽2 𝑋𝑖 ²
• Linear in the parameters
o The conditional expectations of Y are a linear function of βs
NOT: 𝐸(𝑌|𝑋𝑖 ) = 𝛽1 + √𝛽2 𝑋𝑖
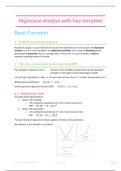
The basic theory of regression analysis supposes linearity in the parameters!
Non-linearity in the variables is permitted:
Econometrics 2019-2020 Casier Tessa
1
,2.2 STOCHASTIC SPECIFICATION OF THE PRF
Population regression function is only on average correct
The deviations of the individual consumption expenditures Yi of their conditional expectation can be
represented as: µ𝑖 = 𝑌𝑖 − 𝐸(𝑌|𝑋𝑖 ) with µi the stochastic error term, hence:
2.3 SOURCE OF THE STOCHASTIC ERROR TERM
The error term = a collection of all variables/factors that affect Y but are not included in the model.
Possible explanations:
• Vague theory
• No proper data available
• Simplicity: other variables only have a marginal (and random) influence
• Measurement errors in the data
• Wrong functional form
• …
(Later: properties error terms determine properties estimators!!!)
3 THE SAMPLE REGRESSION FUNCTION (SRF)
Assumption: we have data for the entire population
• Parameters in the population regression function can simply be calculated (βs)
• No need for estimation methods (econometrics)
In practice: we typically only have a sample drawn from the population
• ‘Randomly’ = for each X-value we draw exactly one Y-value
• Let n denote the sample size
The mission is to reconstruct the population regression curve/function based on this sample.
We do this based on:
• The sample regression curve
• The sample regression function (SRF)
𝑌 ̂1 + 𝛽
̂𝑖 = 𝛽 ̂2 𝑋𝑖 where: ̂𝑖
𝑌 an estimator (E|Xi)
̂1
𝛽 an estimator 𝛽1
̂2
𝛽 an estimator 𝛽2
based on an estimator, which
will be determined later.
Econometrics 2019-2020 Casier Tessa
2
,3.1 TERMINOLOGY: ESTIMATOR VS. ESTIMATION
An estimator = a method (typically based on a formula) to estimate a population parameter
using information in a sample of data
An estimation = A numerical result of the estimator applied to the available sample
3.2 THE SAMPLE REGRESSION FUNCTION
Using the sample, we can not exactly reconstruct the population regression function!!
Reasons:
• The sample regression function (SRF) is merely an approximation of the population
regression function (PRF)
o 𝛽 ̂1 ≠ 𝛽1
o 𝛽 ̂2 ≠ 𝛽2
o 𝑌 ̂𝑖 ≠ 𝑌𝑖
o µ̂𝑖 ≠ µ𝑖
• An estimator is stochastic (= it varies over repeated sampling)
o An alternative sample results in a different sample regression function
3.3 PURPOSE REGRESSION ANALYSIS
Approximate the parameters of the population regression function 𝑌𝑖 = 𝛽1 + 𝛽2 𝑋𝑖 + µ𝑖
̂ ̂ ̂
using the sample regression function 𝑌𝑖 = 𝛽1 + 𝛽2 𝑋𝑖 + µ̂𝑖
̂1 and 𝛽
and make sure that 𝛽 ̂2 approximate 𝛽1 and 𝛽2 ‘as closely as possible’ even though we do not
know the population regression function.
Use an estimator (least squares method)
The performance of the estimator as an approximation will be formalised by the statistical properties
of this estimator.
Econometrics 2019-2020 Casier Tessa
3
, Estimating the Sample Regression
Function
1 THE ORDINARY LEAST SQUARES METHOD (OLS)
How do we estimate the sample regression function based on the sample data?
• Pragmatic approach: find a sample regression line such that the distance between this line
and the observed data points become as small as possible
o Minimize the distance between 𝑌 ̂𝑖 and 𝑌𝑖
• Possible criteria:
o min ∑ µ̂𝑖 : not possible (- and + error terms cancel out)
̂1 ,𝛽
𝛽 ̂2
o min ∑ |µ̂
𝑖 |: possible (less interesting properties)
̂1 ,𝛽
𝛽 ̂2
o min ∑ µ̂𝑖 ²: ordinary least squares (OLS) method
̂1 ,𝛽
𝛽 ̂2
1.1 SOLUTION MINIMIZATION PROBLEM
From
𝑛
̂1 − 𝛽
min ∑(𝑌𝑖 − 𝛽 ̂2 𝑋𝑖 )²
̂1 ,𝛽
𝛽 ̂2
𝑖=1
This is a system of 2 equations and 2 unknowns
̂1 and 𝛽
Hence 𝛽 ̂2 are identified
̂𝟐
OLS estimator 𝜷 on formula sheet
∑ 𝑥𝑖 𝑦𝑖
̂2 =
𝛽
∑ 𝑥𝑖2
where
1
𝑋̅ = ∑ 𝑋𝑖 and xi = Xi - 𝑋̅
2
1
𝑌̅ = ∑ 𝑌𝑖 and yi = Yi - 𝑌̅
2
̂𝟏
OLS estimator 𝜷 on formula sheet
̂1 = 𝑌̅ − 𝛽
𝛽 ̂2 𝑋̅
Econometrics 2019-2020 Casier Tessa
4
The benefits of buying summaries with Stuvia:
Guaranteed quality through customer reviews
Stuvia customers have reviewed more than 700,000 summaries. This how you know that you are buying the best documents.
Quick and easy check-out
You can quickly pay through credit card or Stuvia-credit for the summaries. There is no membership needed.
Focus on what matters
Your fellow students write the study notes themselves, which is why the documents are always reliable and up-to-date. This ensures you quickly get to the core!
Frequently asked questions
What do I get when I buy this document?
You get a PDF, available immediately after your purchase. The purchased document is accessible anytime, anywhere and indefinitely through your profile.
Satisfaction guarantee: how does it work?
Our satisfaction guarantee ensures that you always find a study document that suits you well. You fill out a form, and our customer service team takes care of the rest.
Who am I buying these notes from?
Stuvia is a marketplace, so you are not buying this document from us, but from seller tessacasier. Stuvia facilitates payment to the seller.
Will I be stuck with a subscription?
No, you only buy these notes for $6.19. You're not tied to anything after your purchase.