MATH 225N / MATH225 Statistical Reasoning For Health Sciences (MATH225)
Exam (elaborations)
Chamberlain MATH 225N Week 5 Lab Assignment / MATH225 Week 5 Lab Assignment: (Latest, 2020): Chamberlain College of Nursing | 100 % VERIFIED ANSWERS, GRADE A
24 views 1 purchase
Course
MATH 225N / MATH225 Statistical Reasoning For Health Sciences (MATH225)
Institution
CHAMBERLAIN COLLEGE OF NURSING
MATH 225 Week 5 Lab Assignment / MATH225N Week 5 Lab Assignment: (Latest): Statistical reasoning for health sciences: Chamberlain College of Nursing
MATH 225N Week 5 Lab Assignment / MATH225 Week 5 Lab Assignment: (Latest): Statistical reasoning for health sciences: Chamberlain College of Nursing
math 225 week 5 lab assignment math225n week 5 lab assignment latest statistical reasoning for health sciences chamberlain college of nursing math 225n week 5 lab assignment math225 week 5 la
Written for
CHAMBERLAIN COLLEGE OF NURSING
MATH 225N / MATH225 Statistical Reasoning For Health Sciences (MATH225)
All documents for this subject (50)
Seller
Follow
chamberlain_university
Reviews received
Content preview
MATH225 N Week 5 Assignment: Lab
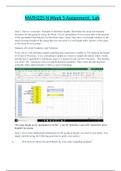
Step 1: Survey or measure 10 people to find their heights. Determine the mean and standard
deviation for this group by using the Week 3 Excel spreadsheet. Post a screen shot of the portion
of the spreadsheet that helped you determine these values. How does your height compare to the
mean (average) height of the group that you surveyed? Is your height taller, shorter, or the same
as the mean of your group?
Measure of Central Tendency and Variation:
In my survey I am utilizing random sampling and a numerical variable as I’m studying the height
of 10 out of 50 nurses. It is a convenience sample as I chose to sample the nurses where I work,
and the data is quantitative continuous since it is numerical and can have fractions. The location
was Tyler, TX. All nurses were in work-from-home positions. They come into the physical
corporate office approximately 3 times a year for meetings.
The mean height in my spreadsheet is 64.80”. I am 60” therefore, I am 4.80” shorter the mean
heightof my group.
Step 2: Give some background information on the group of people you used in your study. You
might consider using the following questions to guide your answer.
a. How did you choose the participants for your study (sampling method)?
, I chose a random sampling of 10 nurses from the 50 registered nurses that I worked with.
b. What part of the country did your study take place in?
All of the nurses were females and lived in the East Texas area.
c. What are the age ranges of your participants?
Ages ranged from 36 years old through 61 years old.
d. How many of each gender did you have in your study?
For this study, I chose only females, therefore there were 10 females.
e. What are other interesting factors about your group?
All the nurses in my study work from home. They were all white females that had been a nurse
for at least 8 years. Eight of the 10 are ADN prepared nurses. Two of the 10 have their BSN.
Three of the ADN nurses are currently in school at Chamberlain University working on their
BSN. One of the BSN prepared nurses is currently attending a local university where she is
working on her MSN. None of the participants were on more than 2 prescription medications.
Step 3: Use the Week 5 Excel spreadsheet for the following.
a. (Use the Empirical Rule tab from the spreadsheet). Determine the 68%, 95%, and 99.7%
values of the Empirical Rule in terms of the ten heights in your height study.
68% fall between 62.1” -67.5”
95% fall between 59.4” – 70.2”
99.7% fall between 56.7” – 72.9”
b. What do these values tell you?
These values tell me that 68% confidence interval tells that there is 68% chance that true
population mean of height will fall between 62.1 to 67.5.
95% confidence interval tells that there is 95% chance that true population mean of height will
fall between 59.4 to 70.2
99.7% confidence interval tells that there is 99.7% chance that true population mean of height
will fall between 56.7 to 72.9.
Post a screen shot of your work from the Week 5 Excel spreadsheet.
The benefits of buying summaries with Stuvia:
Guaranteed quality through customer reviews
Stuvia customers have reviewed more than 700,000 summaries. This how you know that you are buying the best documents.
Quick and easy check-out
You can quickly pay through credit card or Stuvia-credit for the summaries. There is no membership needed.
Focus on what matters
Your fellow students write the study notes themselves, which is why the documents are always reliable and up-to-date. This ensures you quickly get to the core!
Frequently asked questions
What do I get when I buy this document?
You get a PDF, available immediately after your purchase. The purchased document is accessible anytime, anywhere and indefinitely through your profile.
Satisfaction guarantee: how does it work?
Our satisfaction guarantee ensures that you always find a study document that suits you well. You fill out a form, and our customer service team takes care of the rest.
Who am I buying these notes from?
Stuvia is a marketplace, so you are not buying this document from us, but from seller chamberlain_university. Stuvia facilitates payment to the seller.
Will I be stuck with a subscription?
No, you only buy these notes for $15.49. You're not tied to anything after your purchase.