ECN226 Capital Markets 1 – 2018 Past Paper Questions and Answers
51 views 0 purchase
Course
ECN226 Capital Markets 1 (ECN226)
Institution
Queen Mary, University Of London (QMUL)
High-quality past paper questions and answers for the ECN226 Capital Markets 1 module for the Queen Mary University of London (QMUL) Economics Course. Each question is reproduced and high-quality full-mark scores are written up clearly for each one. Great for preparing for exams, studying and solid...
FOR MORE HIGH-QUALITY PAST PAPER MODEL ANSWERS, ONLINE TUTORING AND
ECONOMICS HELP, visit LondonEconomicsTutors.co.uk.
Discounted prices compared to all other websites
ECN226 Capital Markets 1 – 2018
Questions and Answers
Question 1
The Fama and French (1996) model is a model to describe stock returns. The three factors it uses to
describe stock returns are three factors are (1) market risk, (2) the outperformance of small versus
big companies, and (3) the outperformance of high book/market versus small book/market
companies. takes the single market portfolio-based risk factor of the CAPM and supplements it with
two additional risk influences known to affect security prices; this is ta firm size factor and a book-to-
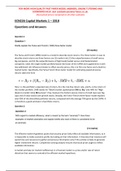
market factor. Specifically, the Fama-French three-factor model for estimating expected excess
returns takes the form
Here r is the portfolio's expected rate of return, Rf is the risk-free return rate, and Rm is the return of
the market portfolio. SMB stands for "Small [market capitalization] Minus Big" and HML for "High
[book-to-market ratio] Minus Low"; they measure the historic excess returns of small caps over big
caps and of value stocks over growth stocks. Broadly, the Fama–French three-factor model explains
over 90% of the diversified portfolios returns, compared with the average 70% given by the CAPM. It
is therefore a good estimator of portfolio returns.
Question 2
The efficient market hypothesis posits that security prices fully reflect all available information, so it
is impossible to make economic profits by trading on that information. It theorises that investors will
spend time and resources to gather and process information only if this activity is likely to generate
higher investment returns. Competition among analysis ensures that stock prices ought to reflect
available information.
A market anomaly (or market inefficiency) in a financial market is a price and/or rate of return
distortion that seems to contradict the efficient-market hypothesis.
, FOR MORE HIGH-QUALITY PAST PAPER MODEL ANSWERS, ONLINE TUTORING AND
ECONOMICS HELP, visit LondonEconomicsTutors.co.uk.
Discounted prices compared to all other websites
One such anomaly is calendar effects, which are market anomalies which appears to be related to
the calendar. For example, the January effect where securities' prices increase in the month of
January more than in any other month, the reason being that individual investors sell stocks for tax
reasons at year end.
Another anomaly is a lack of market transparency. This is one of the conditions for a free market to
be efficient and requires that there if full information about what products and services or capital
assets are available, market depth (quantity available), what price, and where. While stock markets
are relatively transparent, hedge funds are less so.
Another anomaly is the “small-cap effect”, which is the observation that small capitalization
companies do better than indexes on average. This indicates that investors are not fully taking into
account all available information, and that therefore there is a market anomaly.
Question 3
A risk factor model gives the relationship between risk and expected return. It may be a single factor
model, as the capital asset pricing model (CAPM), or a multiple risk factor model, as the arbitrage
pricing theory model (APT).
In general, the expected return-beta relationship is:
Re=Rf+β1∗RP1+β2∗RP2
We have to find the two risk premiums.
Substituting the known numbers for portfolio A in the above expression, we get:
Stuvia customers have reviewed more than 700,000 summaries. This how you know that you are buying the best documents.
Quick and easy check-out
You can quickly pay through credit card or Stuvia-credit for the summaries. There is no membership needed.
Focus on what matters
Your fellow students write the study notes themselves, which is why the documents are always reliable and up-to-date. This ensures you quickly get to the core!
Frequently asked questions
What do I get when I buy this document?
You get a PDF, available immediately after your purchase. The purchased document is accessible anytime, anywhere and indefinitely through your profile.
Satisfaction guarantee: how does it work?
Our satisfaction guarantee ensures that you always find a study document that suits you well. You fill out a form, and our customer service team takes care of the rest.
Who am I buying these notes from?
Stuvia is a marketplace, so you are not buying this document from us, but from seller londoneconomicstutors. Stuvia facilitates payment to the seller.
Will I be stuck with a subscription?
No, you only buy these notes for $5.37. You're not tied to anything after your purchase.