100% satisfaction guarantee Immediately available after payment Both online and in PDF No strings attached
Previously searched by you
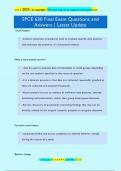
visual analysis of graphed data is the cornerstone of and most frequently used data analysis method in SCD research, particularly for determining whether a study demonstrates experimental control. involves systematic procedures used to evaluate specif$13.49
Add to cart
visual analysis of graphed data is the cornerstone of and most frequently used data analysis method in SCD research, particularly for determining whether a study demonstrates experimental control. involves systematic procedures used to evaluate specif
7 views 0 purchase
Course
SPCE 630
Institution
SPCE 630
Visual Analysis
Involves systematic procedures used to evaluate specific data patterns
and evaluates the presence of a functional relation.
What is visual analysis used for?
-Can be used to evaluate data of individuals or small groups depending
on the unit analysis specified in the researc...
✓ Predictability and consistency of data values within a condition or lack of
fluctuations in adjacent.
The objective of between conditions visual analysis (conditions analysis)
✓ To identify if behavior change has occurred
Functional relations
✓ Unequivocal demonstrations that an independent variable (intervention)
produced reliable and consistent change in a dependent variable (target
behavior)
Immediacy of change across adjacent conditions
✓ The degree to which behavior change occurs as soon as the intervention
is introduced.
Overlap
✓ Refers to the values of data in one condition that are in the same range
of values of the data in the subsequent adjacent condition.
1 | P a g e | G r a d e A + | 2 0 0 2 5
The benefits of buying summaries with Stuvia:
Guaranteed quality through customer reviews
Stuvia customers have reviewed more than 700,000 summaries. This how you know that you are buying the best documents.
Quick and easy check-out
You can quickly pay through credit card or Stuvia-credit for the summaries. There is no membership needed.
Focus on what matters
Your fellow students write the study notes themselves, which is why the documents are always reliable and up-to-date. This ensures you quickly get to the core!
Frequently asked questions
What do I get when I buy this document?
You get a PDF, available immediately after your purchase. The purchased document is accessible anytime, anywhere and indefinitely through your profile.
Satisfaction guarantee: how does it work?
Our satisfaction guarantee ensures that you always find a study document that suits you well. You fill out a form, and our customer service team takes care of the rest.
Who am I buying these notes from?
Stuvia is a marketplace, so you are not buying this document from us, but from seller TestTrackers. Stuvia facilitates payment to the seller.
Will I be stuck with a subscription?
No, you only buy these notes for $13.49. You're not tied to anything after your purchase.