To generate charts and graph visuals for an entire dataset
To manually design each visual element in the report
To filter data based on specific criteria before visualization
To create detailed reports for individual data points
Term 2 of 125
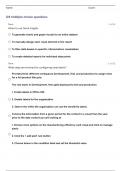
What steps are involved for configuring email alerts?
Provides three different workspaces Development, Test, and productions to assign roles
for a full product lifecycle.
The role starts in Development, then gets deployed to test and production
1. Create labels in Office 365
2. Enable labels for the organization
3. Select who within the organization can use the sensitivity labels
It shows the information from a given period for the context in a visual from the year
prior to the date context you are looking at
1. Choose more options on the manufacturing efficiency card visual and click on manage
alerts
2. Click the + add alert rule button
3. Choose below in the condition field and set the threshold value
,Term 3 of 125
Column quality
1. Add a slicer to each of the pages with the same field selected and configure synch
slicers
2. Add a report level filter
1. Click Publish App button
2. Specify the users who can view the app in the permissions tab
3. Select the department workspace
4. Provide app name and description under setup tab
Same as Admin but cannot assign roles, delete workspaces, or change metadata
Shows valid empty or error values in a column. By default only shows the first 1000 rows,
but if you change the profiling it can show the entire column
Term 4 of 125
Column Distribution
Shows the amount of distinct and unique values in a column
Illustrates the average value of entries in a column
Displays the total count of all values in a column
Compares values across multiple columns for analysis
,Term 5 of 125
What is the difference between Session Diagnostics and Step Diagnostics
1. Choose more options on the manufacturing efficiency card visual and click on manage
alerts
2. Click the + add alert rule button
3. Choose below in the condition field and set the threshold value
SAMEPERIODLASTYEAR() and DATEADD()
Step diagnostics evaluates how a single step works in power query where as session
diagnostics interacts with the data source for all steps in the transformation process
Provides three different workspaces Development, Test, and productions to assign roles
for a full product lifecycle.
The role starts in Development, then gets deployed to test and production
Term 6 of 125
How can you show animation in graphics?
Append queries
Play axis or D3.js
Add the permitted custom visuals to organization visuals
Data classifications are divined at the tenant level
Term 7 of 125
How can you debug slow performance of visuals?
Common data model folders
By analyzing your metadata
By using performance analyzer
Select month in the field list and use sort by column on month number
, Term 8 of 125
How to combine multiple tables with the same common key
Append Queries
Merge Columns
Combine Files
Merge Queries
Term 9 of 125
What Connector does Dataverse use?
Common data model folders, data flows are stored in csv files
Azure data lake gen2
TDS (Tabular Data Stream) protocol
1. choose more options on the manufacturing efficiency card visual and click on manage
alerts
2. click the + add alert rule button
3. choose below in the condition field and set the threshold value
Term 10 of 125
How to connect power bi to Visual Studio Data Tools
From the Power Bi admin portal, configure the XMLA endpoint as Read Write
Connect power bi directly to sql server without any configuration
Export data from power bi to excel for analysis
Use the power bi desktop application to create a new report
The benefits of buying summaries with Stuvia:
Guaranteed quality through customer reviews
Stuvia customers have reviewed more than 700,000 summaries. This how you know that you are buying the best documents.
Quick and easy check-out
You can quickly pay through credit card or Stuvia-credit for the summaries. There is no membership needed.
Focus on what matters
Your fellow students write the study notes themselves, which is why the documents are always reliable and up-to-date. This ensures you quickly get to the core!
Frequently asked questions
What do I get when I buy this document?
You get a PDF, available immediately after your purchase. The purchased document is accessible anytime, anywhere and indefinitely through your profile.
Satisfaction guarantee: how does it work?
Our satisfaction guarantee ensures that you always find a study document that suits you well. You fill out a form, and our customer service team takes care of the rest.
Who am I buying these notes from?
Stuvia is a marketplace, so you are not buying this document from us, but from seller selftest. Stuvia facilitates payment to the seller.
Will I be stuck with a subscription?
No, you only buy these notes for $9.00. You're not tied to anything after your purchase.