Using R for Introductory Statistics 2nd Edition By John Verzani 9781466590731 ALL Chapters
Using R for Introductory Statistics 2nd Edition By John Verzani 9781466590731 ALL Chapters
All for this textbook (3)
Written for
Using R for Introductory Statistics 2nd Edition By
All documents for this subject (3)
Seller
Follow
phinta004
Reviews received
Content preview
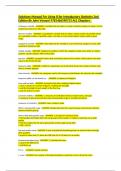
Solutions Manual For Using R for Introductory Statistics 2nd
Edition By John Verzani 9781466590731 ALL Chapters .
continuous variable - ANSWER: A variable that can take on a wide or infinite number of values. Can be
analysed as interval or ratio data.
discrete variable - ANSWER: a quantitative variable that has either a finite number of possible values
or a countable number of possible values. can take on only certain distinct values within a given
range.
categorical variable - ANSWER: value taken by the variable is a non-numerical category or class. AKA
nominal or frequency data
ranked variable - ANSWER: categorical variable in which the categories imply some order or relative
position. Usually asigned. AKA nominal data
dot plot - ANSWER: a graphical device that summarizes data by the number of dots above each data
value on the horizontal axis
frequency table - ANSWER: A table for organizing a set of data that shows the number of times each
item or number appears.
class intervals - ANSWER: the categories used in the frequency distributions for interval-ratio variables
frequency table can be plotted as... - ANSWER: a frequency histogram
stem and leaf plots - ANSWER: summarise the data, retaining original values
1. stem: consists of a column of figures, omitting the last digit
2. add the final digit of each weight in the final row
3. put the 'leaves' in order
summary statistics - ANSWER: 1. measures of centrality (central or typical value, average)
2. measures of spread around that value (interquartile range or standard deviation)
measures of centrality - ANSWER: mean, median, mode
What is interquartile range - ANSWER: divides data into four 'equal' groups and measures distance
between farthest groups
How to find interquartile range - ANSWER: 1. put data in numerical order
2. find median and divide data into two groups at the median. if median is odd then put in both
groups
3. find the median for the lower group (Q1) and the upper group (Q3)
4. IQR = Q3-Q1
box and whisker plots - ANSWER: A way of graphically depicting groups of numerical data through
their quartiles.
if a point is more than 1.5 times the IQR from Q1 or Q3 then it is an outlier
Standard deviation steps - ANSWER: 1. calculate the mean
2. square the differences
3. add them up
S^2 is... - ANSWER: sample variance
z- score - ANSWER: the number of standard deviations a particular score is from the mean
, e.g. Z score is +1 meeaans it is one SD above the mean
for normal distributions... - ANSWER: 68% of the data are within one standard deviation from the
mean
95% are within 1.96 standard deviations from the mean
standard error - ANSWER: the precision of the sample mean
standard error equation
confidence interval equation - ANSWER: CI = x +- 1.96 x SE
What do X and x represent - ANSWER: X is the random variable
x is numerical outcomes
probability that a random variable X has value x can be written as... - ANSWER: Pr(X=x) or p(x)
Must add up to one
Binomial random variable - ANSWER: one with just two possible outcomes e.g. coin toss
Arbitrarily refer to outcomes as either a success or a failure
Bernoulli trial criteria - ANSWER: 1. the result of each trial is either a success or a failure
2. the probability, p, of a success is the same for every trial
3. trials are independent of each other
if p is probability, k is number of successes and n is the number of trials, what is the equation for the
probability of obtaining a particular SEQUENCE of successes and failures - ANSWER: p^k (1-p)^n-k
if p is probability, k is number of successes and n is the number of trials, what is the equation for
the probability of obtaining a particular NUMBER of successes and failures (order doesn't matter)
binomial coefficient - ANSWER: the number of ways of getting k successes in n trials
sign tests - ANSWER: tells us what the probability of observing a bias by chance (e.g. getting 60 heads
out of 100 coin flips)
probability that if we reject the null we are doing so incorrectly
less than 1/20 is usually enough to trust rejecting the null
fuzzy central limit theorem - ANSWER: data that are influenced by many unrelated random effects are
approximately normally distributed
chi-squared test equation
degrees of freedom - ANSWER: categories - 1
Yate's correction for 1df - ANSWER: for data with only 2 categories, subtract 0.5 from each value of 'o-
e'
chi-squared: reject the null hypothesis if... - ANSWER: calculated value is greater than or equal to the
specified value
Data transformation: logs - ANSWER: if there is a huge skew in the data then take natural logs of both
variables
natural log is the same as - ANSWER: ln (AKA loge)
The benefits of buying summaries with Stuvia:
Guaranteed quality through customer reviews
Stuvia customers have reviewed more than 700,000 summaries. This how you know that you are buying the best documents.
Quick and easy check-out
You can quickly pay through credit card or Stuvia-credit for the summaries. There is no membership needed.
Focus on what matters
Your fellow students write the study notes themselves, which is why the documents are always reliable and up-to-date. This ensures you quickly get to the core!
Frequently asked questions
What do I get when I buy this document?
You get a PDF, available immediately after your purchase. The purchased document is accessible anytime, anywhere and indefinitely through your profile.
Satisfaction guarantee: how does it work?
Our satisfaction guarantee ensures that you always find a study document that suits you well. You fill out a form, and our customer service team takes care of the rest.
Who am I buying these notes from?
Stuvia is a marketplace, so you are not buying this document from us, but from seller phinta004. Stuvia facilitates payment to the seller.
Will I be stuck with a subscription?
No, you only buy these notes for $17.99. You're not tied to anything after your purchase.