BTEC IT Unit 5 Data Modelling Assignment 2 (DISTINCTION)
102 views 1 purchase
Course
Unit 5 - Data Modelling
Institution
PEARSON (PEARSON)
This assignment received DISTINCTION for covering:
B.P3: Produced designs for a data model which meet client requirements.
B.P4: Reviewed the designs with others, to identify and inform improvements.
B.M2: Justified decisions made, showing how the design will fulfil its purpose and client requi...
UNIT 5: DATA
MODELLING
The design and development of a data model
, Unit 5: Data Modelling
Table of Contents
Task 1: Create a task plan to manage your time by setting relevant targets with timescales. .........3
Task 2: Produce a detailed functional specification which includes: .................................................4
..........................................................................................................................................................6
Task 4: Your design should include several alternative designs.........................................................9
I would choose the alternative table over the other one as if it is not only visually appealing with
colours but also the texts are in bold which make it more understandable and more organised
compared to the other table, which looks dull, basic, and not aesthetically appealing for the
employees and users.........................................................................................................................9
Task 5: Review the data model design proposals with others to identify and inform improvements.
Email your manager to request a meeting so that you can evaluate the designs and discuss the
timescale of the project and how you can improve the quality, effectiveness, and appropriateness
of the designs. Use this feedback to improve your design and keep a record of all correspondence
and meetings.....................................................................................................................................9
Task 6: Justify the design decisions you made and how you arrived at the final design. ...............15
Task 7: Develop the model based on your final design model using a range of appropriate,
advanced spreadsheet features and functions. ..............................................................................18
........................................................................................................................................................25
.........................................................................................................................................................25
Colour Schemes:..............................................................................................................................26
Structural Features:.........................................................................................................................26
Task 8: Carry out comprehensive testing for correctness, functionality and acceptance using the
test plan you created, checking that it functions as it should and that it produces the correct
results..............................................................................................................................................27
Task 9: Demonstrate your completed model to a user and collect their feedback, using their
feedback and results of your testing to refine and optimise your data model. .............................33
Peer 2 feedback:..............................................................................................................................35
I like the colour scheme; it's very easy on the eyes, as it they are related to the cheese................35
All of the buttons are correct and come in a variety of colours.......................................................35
The layout is very consistent............................................................................................................35
From the picture at the bottom of the, I have sent an email to the tutor in order to gather
feedback:.........................................................................................................................................37
.........................................................................................................................................................37
.........................................................................................................................................................37
My tutor has responded to my email, providing me with some advice in order to make my
spreadsheet more efficient, which is ensuring that the columns heading is visible, as I realised that
some of them are not completely visible. This is an example:.........................................................37
Task 10: Evaluate the data model considering against client requirement and how well it meets
the client’s requirements. ..............................................................................................................38
1
, Unit 5: Data Modelling
Task 11: Your evaluation should be supported by a self-evaluation report that shows a systematic
and accurate review of your own skills, performance and behaviours and the impact that this had
on the development of the final website. ......................................................................................43
Introduction
As I got hired by the cheese company as a trainee data analyst, I was asked to produce a
spreadsheet model regarding the cheese in which it has the ability to predict the probable
effect of exchange rate fluctuations o the company profit margins. In order to achieve it, I
need to create and design tools and functions of the spreadsheet models that will meet the
entry requirements. Add on to that, creating a test plan for the spreadsheet to make sure
that the features and tools work consequently. Thus, by going through each of the designs I
will review them, while asking my peers to get feedback to help me improve on these
features. Finally, I will create an evaluation for this spreadsheet model, qualifying how I met
the requirements, and having the final creation of an effective and efficient spreadsheet
model.
2
, Unit 5: Data Modelling
Task 1: Create a task plan to manage your time by setting
relevant targets with timescales.
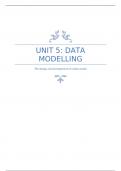
Gantt chart, similarly, to a bar chart, is a project management method that represents a
project plan, it plots time along the horizontal axis which will immediately give the task
while the other axis represents tasks/activities. The Gantt represents each activity by bar
and the bar represents the time scheduling, while it indicates what the various activities are,
how long will they last according to the task/activity, the start and end date of the activities
and the whole project.
27/03/2023
28/03/2023
29/03/2023
30/03/2023
31/03/2023
17/04/2023
18/04/2023
19/04/2023
20/04/2023
21/04/2023
22/04/2023
23/04/2023
24/04/2023
25/04/2023
26/04/2023
27/04/2023
28/04/2023
29/04/2023
30/04/2023
01/05/2023
02/05/2023
03/05/2023
04/05/2023
05/05/2023
06/05/2023
07/05/2023
08/05/2023
09/05/2023
10/05/2023
11/05/2023
12/05/2023
13/05/2023
14/05/2023
15/05/2023
16/05/2023
17/05/2023
18/05/2023
19/05/2023
20/05/2023
21/05/2023
22/05/2023
23/05/2023
24/05/2023
25/05/2023
26/05/2023
27/05/2023
28/05/2023
Task Description
Create a Plan using a Gantt Chart
Produce a detailed functional specification
Produce detailed designs
Alternative designs
Review data model
Justfify design decisions
Develop spreadhseet model
Carry out testing
Demonstrate my model
Evaluate spreadsheet model
Evaluation should be supported by self-evaluation
For the first task when it comes to creating a plan using Gantt chart, it only takes generally 1
day, however I put 2 days to review the plan and change depending on the task
descriptions. The second task takes 2 days as it involves producing a plan of creating the
spreadsheet model within the specification as in creating a plan and testing and revising the
designs needed to use. When it comes to detailed designs, I would need to make a list of the
designs needed when developing the spreadsheet, while revising them so this will take 3
days.
Alternative designs are needed in case of a minor inconvenience when making the
spreadsheet model, while revising them to make sure that I am good at these designs, which
is the reason why it will take 3 days, as there are only 3 days left before the first weekend, I
will complete with the alternative designs. Reviewing data model will only take 2 days as it
involves examining the data model, making sure that it is error-free and accurate. When
developing spreadsheet model, this will take long time, which is why I will develop it in from
1 may to 5 while including 28 April, which involves using designs detailed while using
alternative ones in order to create tables.
Similar to developing spreadsheet model, carrying out testing will take 5 days as I will test to
make sure that the spreadsheet is functioning normally and correctly while styling the
model so that it will be appealing and navigational for the users. Demonstrating model will
only take 3 days as I will use the rest of the days as both evaluation and self-evaluation will
3
, Unit 5: Data Modelling
require explaining in depth and clearly so they take longer to make sure that they are
written in a professional way.
Task 2: Produce a detailed functional specification which
includes:
The Problem:
One of the challenges the cheese company is currently facing is converting euros to pounds
in order to keep up with the economic growth. Inaccurately converting euros to pounds
using the live exchange rate leads to wrongness of data, the cheese company would and
should be able to predict the changes needed to be made as the exchange rate varies in the
cheese company within the economic growth.
The Functions:
As there are loads of useful functions within the spreadsheet model, I will fix these issues
using some of these functions while creating the spreadsheet model, which are:
Sum Function: This function is used sum the chosen values in total which might and
will be used to calculate the overall monthly or yearly outcome.
Average Function: The average function is used to find out the average of a group of
data as in the overall average monthly or yearly sales of the cheese company.
If Function: I will use the IF function in order to predict the total value by stating IF this
occurs, then the outcome must be like as stated.
Count Function: Count Function is also useful as it is used to count how many times
the cheese is displayed in the database.
Count If Function: Similar to Count Function, I will use it to count how many times
the cheese is displayed in the database, while stating IF occurs then the outcome must be
like as I stated it.
4
The benefits of buying summaries with Stuvia:
Guaranteed quality through customer reviews
Stuvia customers have reviewed more than 700,000 summaries. This how you know that you are buying the best documents.
Quick and easy check-out
You can quickly pay through credit card or Stuvia-credit for the summaries. There is no membership needed.
Focus on what matters
Your fellow students write the study notes themselves, which is why the documents are always reliable and up-to-date. This ensures you quickly get to the core!
Frequently asked questions
What do I get when I buy this document?
You get a PDF, available immediately after your purchase. The purchased document is accessible anytime, anywhere and indefinitely through your profile.
Satisfaction guarantee: how does it work?
Our satisfaction guarantee ensures that you always find a study document that suits you well. You fill out a form, and our customer service team takes care of the rest.
Who am I buying these notes from?
Stuvia is a marketplace, so you are not buying this document from us, but from seller lydii. Stuvia facilitates payment to the seller.
Will I be stuck with a subscription?
No, you only buy these notes for $12.81. You're not tied to anything after your purchase.