Summary Chapter 3 - Week 2 - George J. Bordas (2021). Labor Economics, 8th Ed
Labor Economics
All for this textbook (4)
Written for
Universiteit van Amsterdam (UvA)
Economics and Business Administration
Labour Economics (6013B0468Y)
All documents for this subject (1)
Seller
Follow
Egbert1976
Reviews received
Content preview
Labour Economics
Topic 4
Lecture 1: inequality/ wage structure
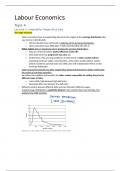
The wage structure
- Labor economists have a longstanding interest in the origins of the earnings distribution (the
way income is distributed):
o the last decades have witnessed a widening of the earnings distribution;
o labor economists have difficulties in fully understanding why this is.
- Policy makers play an important role in shaping the earnings distribution:
o they are concerned about equity/efficiency trade-offs;
o they determine how progressive tax rates are;
o furthermore, they are responsible for all other kinds of labor market policies
(including minimum wages, social benefits, active labor market policies, family
policies related to parental leave and child care) with independent effects on the
earnings distribution.
- Labor economists typically use labor supply/labor demand framework to better understand
the origins of earnings inequality.
- We follow this tradition and consider the labor market responsible for setting the price for
different types of labor:
o scarce skills, high demand: high skill price;
o abundant skills, low demand: low skill price.
- Different workers possess different skills and earn therefore different wages.
- A typical wage distribution is positively skewed: many workers have low earnings, few
workers have high earnings.
, -
o Trends in median and mean annual earnings in the US
- Why is the wage distribution positively skewed?
o with positive returns on ability, high-ability workers earn more than low-ability
workers;
o with positive returns to schooling, high-ability workers invest more in human capital
than low-ability workers;
o high-ability workers thus earn more than low-ability workers because they are more
able and because they are better educated;
- The wage distribution is consistent with a human capital accumulation model.
- In case of a symmetric ability distribution, we still end up with a skewed skill distribution, as
skill is the composite skill measure of both ability and schooling.
o But there are other mechanisms too.
-
o The wage gap between college and high-school graduates rises.
The wage structure: Measuring earnings inequality
- Measuring earnings inequality was for a long time an important subfield of labor economics.
- While economists recognize that inequality is a complex concept, there is a strong tendency
to summarize inequality in one number.
,- One of the popular inequality measures is the Gini coefficient, which is a number between 0
and 1 that is rising in inequality; that is, 0 represents complete equality and 1 represents
complete inequality.
- How to arrive at the Gini coefficient?
o The Gini coefficient builds on total income (all the income held by all families) and
income shares (all the income held by the accumulated share of families, ranked by
their income).
o Suppose we express the income distribution by means of how much of total income
the top 10% and bottom 10% families receives.
In case each family has the same income, the bottom 10% holds 10% of total
income, top 10% holds 10% of total income.
In case only one family holds all income: the bottom 10% holds 0% of total
income, top 10% holds 100% of total income.
o Lorenz curve reports the cumulative share of total income held by the cumulative
share of families, ranked by their incomes.
In case of complete equality (every family has the same income), the Lorenz
curve is a straight line
In case of complete inequality (all the income is generated by the richest
family), Lorenz curve is a flat line, and shoots up as a straight line when all
families are considered.
o The Gini coefficient can be graphically derived from the Lorenz curve; that is, it is
difference between the hypothetical Lorenz curve under complete equality and the
actual Lorenz curve, describing the actual income distribution.
, - But the Gini coefficient is not perfect:
o different changes in income distributions may lead to identical changes in Gini
coefficients.
- Nowadays most labor economists are more practical and agree that no single measure is
perfect, and that most available measures capture the essence of the earnings distribution.
- Often used alternatives:
o 90-10 and 50-10 wage gaps: these give the percentage wage difference between the
90th (or 50th) and 10th percentile;
o income shares of the super rich: top 10 percent (P90-100) top 5 percent (P95-100),
top 1 percent (P99-100) and so on.
- Presenting both is informative about the location of wage differences
The wage structure: Some other facts
- In most western societies in the 80s, 90s, and 00s wage dispersion increased substantially.
Not only wage gap widened dramatically, but also
o wage differentials widened between education, experience and age groups;
o wage differentials widened within groups.
The benefits of buying summaries with Stuvia:
Guaranteed quality through customer reviews
Stuvia customers have reviewed more than 700,000 summaries. This how you know that you are buying the best documents.
Quick and easy check-out
You can quickly pay through credit card or Stuvia-credit for the summaries. There is no membership needed.
Focus on what matters
Your fellow students write the study notes themselves, which is why the documents are always reliable and up-to-date. This ensures you quickly get to the core!
Frequently asked questions
What do I get when I buy this document?
You get a PDF, available immediately after your purchase. The purchased document is accessible anytime, anywhere and indefinitely through your profile.
Satisfaction guarantee: how does it work?
Our satisfaction guarantee ensures that you always find a study document that suits you well. You fill out a form, and our customer service team takes care of the rest.
Who am I buying these notes from?
Stuvia is a marketplace, so you are not buying this document from us, but from seller Egbert1976. Stuvia facilitates payment to the seller.
Will I be stuck with a subscription?
No, you only buy these notes for $17.23. You're not tied to anything after your purchase.