Mathematical Methods using Python,
1st Edition by Vasilis Pagonis
Complete Chapter Solutions Manual
are included (Ch 1 to 13)
** Immediate Download
** Swift Response
** All Chapters included
, i i
i i
Introduction to Python
1
1.1 END OF CHAPTER PROBLEMS
1. A uniform distribution of random numbers
Create 100 random numbers x from a uniform distribution using the random() function
in Python. Plot these 100 random numbers on the xy-plane, and also in the form of a
histogram. Find the average and the standard deviation of these 100 numbers.
Solution:
We use the random(100) function from the random() library in NumPy, to create the
Numpy array with 100 random numbers.
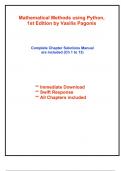
The average of the 100 numbers is 0.529, which is close to the expected value of 0.5. The
distribution in the histogram plot looks almost flat, as expected for a random distribution.
import numpy as np
import matplotlib.pyplot as plt
print('-'*28,'CODE OUTPUT','-'*29,'\n')
plt.subplot(1,2,1)
rnd=np.random.random(100)
plt.plot(rnd,'ro')
plt.xlabel('Index')
plt.ylabel('Random value')
plt.title('(a)')
plt.subplot(1,2,2)
plt.hist(rnd);
plt.xlabel('N')
plt.ylabel('Distribution')
plt.title('(c)')
plt.tight_layout()
plt.show()
print('Mean = ',round(np.mean(rnd),3))
print('Standard deviation = ',round(np.std(rnd),3))
---------------------------- CODE OUTPUT -----------------------------
1
i i
i i
, i i
i i
2 Introduction to Python
(a) (c)
1.0 14
12
0.8
10
Random value
0.6
Distribution
8
0.4 6
4
0.2
2
0.0
0
0 25 50 75 100 0.00 0.25 0.50 0.75 1.00
Index N
Mean = 0.52
Standard deviation = 0.294
Figure 1.1 A two panel graphic from Problem 1.1, showing 100 random numbers from a uniform
distribution on the left, and their histogram on the right.
i i
i i
, i i
i i
END OF CHAPTER PROBLEMS 3
2. A Gaussian distribution of random numbers
Create 100 random numbers from a Gaussian distribution using the random.normal() func-
tion in Numpy, and plot them as a histogram. Find their average and standard deviation.
Solution:
We use the normal(3,1, 100) function from the random() library in NumPy, to create
the Numpy array with 100 random numbers from a Gaussian distribution located at x = 3
and with a standard deviation of σ =1.
The distribution of numbers in the histogram plot shows the expected bell-shape curve,
and the mean of the 100 numbers is < x >=2.989 very close to the expected value of
< x >=3. Similarly, the standard deviation of the 100 numbers is σ =1.097 very close to
the expected value of σ =1.
import numpy as np
import matplotlib.pyplot as plt
print('-'*28,'CODE OUTPUT','-'*29,'\n')
def f(rnd):
return np.mean(rnd), np.std(rnd)
plt.subplot(1,2,1)
rnd=np.random.normal(3,1,100)
plt.plot(rnd,'ro')
plt.xlabel('N')
plt.ylabel('Random value')
plt.title('(a)')
plt.subplot(1,2,2)
plt.hist(rnd,10);
x=np.linspace(0,7,100)
plt.title('(b)')
plt.xlabel('N')
plt.ylabel('Distribution of values')
plt.xlim(0,7);
plt.title('(b)')
plt.show()
print('Mean = ',round(np.mean(rnd),3))
print('Standard deviation = ',round(np.std(rnd),3))
---------------------------- CODE OUTPUT -----------------------------
i i
i i