Notes on the live lectures for the course Introduction to Statistics. Contains explanations and solutions for the problems presented during the lectures. Covers important exercises which are likely to come up on the exam.
STATISTICS – LECTURE NOTES
CHAPTER 1 & 2
֎ why do we need statistics?
- to see the real data and analyze them in order to come to conclusions about some
concepts
- to handle and interpret data so that we can gain knowledge from them
- intuition evidence-based decision making
- to help with making well-informed decision
- we are bombarded with statistics everywhere and we need to make sense out of these
numbers and statistics is the only way to make sense of these figures
- the statistics is fundamentally about uncertainty
- difference between mathematics and statistics: statistics are about things which cannot
be fully calculated, mathematics are more concrete
- sampling: core part of statistics
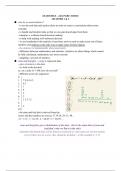
֎ stem and leaf plot – a way to represent data
- gives structure to the data
- we look at the decimal
ex. on a scale of 1-100, how do you feel?
- different scores are organized
0
1 798845
2 92
3 1
4 8
5 3
6 2
7 13572
8
9 2
10
- the stem and leaf plot is derived from the
scores and the numbers are seen as 17,19,18, 29, 31, 48…
- 0 = 1-9 ; 1 = 10-19 ; 2 = 20-29 ; 3 = 30-39 …
stem and leaf plots give a distribution of the data – that is the main idea of stem and
leaf (that’s why we flip it to the side)
uniformly distributed data will be falsely presented if we omit some sets of observations
(even if there are no scores, they should be included – in this example 3, 4 ,5)
,֎ N – population ; n –sample
֎ the inferences we make are about a hypothetical population (people who live, who are
about to be born, who have lived) ; the entire population cannot be tested
- this is why we always use sampling
- conclusions are based on sample statistics
֎ example: how often have you moved house?
we have data responses data responses
- we build a frequency table – we have values, which are the reported scores
X – all the options people could give
f – frequency of the answers
what is the percentile rank of having moved 4 times = 75% (looking at the cumulative %)
- if you have moved more than 4 times, you have moved more often than 75% of the
population
֎ height in cm – a midpoint of an interval
ex. 180 cm – corresponds to an interval (has lower and upper limits)
- there could be multiple values which fir into this interval
, the next decimal place determines the intervals
֎ question 2.10
X f cumulative %
20-24 2 100
15-19 3 90
10-14 3 75
5-9 10 60
0-4 2 10
what is the cumulative percentile rank for the value of X = 9.0?
we are talking about intervals so we are talking about the intervals of 0-4/ 5-9
X c%
5-9 60
-the upper real limit is 9.5
0-4 10
- the upper real limit is 4.5
first step: how many points do we need to go down from 9.5 to reach 9?
answer: 0.5
the whole interval has a size of 5
we create a fraction = 0.5/5 = 0.1 (point of
interest)
we need to go 0.1 = 10% down to reach 9
50 x 0.1 = 5
60 – 5 = 55%
therefore, the value of 9 corresponds to 55%
percentile rank
50 is the size of the interval of cumulative
percentages
CHAPTERS 3 & 4
central tendency of data – expresses info about the average of the data
variability (spread of data)
data as distributions
- histogram – expresses the frequency and scores
The benefits of buying summaries with Stuvia:
Guaranteed quality through customer reviews
Stuvia customers have reviewed more than 700,000 summaries. This how you know that you are buying the best documents.
Quick and easy check-out
You can quickly pay through credit card or Stuvia-credit for the summaries. There is no membership needed.
Focus on what matters
Your fellow students write the study notes themselves, which is why the documents are always reliable and up-to-date. This ensures you quickly get to the core!
Frequently asked questions
What do I get when I buy this document?
You get a PDF, available immediately after your purchase. The purchased document is accessible anytime, anywhere and indefinitely through your profile.
Satisfaction guarantee: how does it work?
Our satisfaction guarantee ensures that you always find a study document that suits you well. You fill out a form, and our customer service team takes care of the rest.
Who am I buying these notes from?
Stuvia is a marketplace, so you are not buying this document from us, but from seller anniedeshkova. Stuvia facilitates payment to the seller.
Will I be stuck with a subscription?
No, you only buy these notes for $5.87. You're not tied to anything after your purchase.