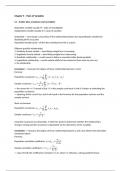
This is a summary of the data analysis course. It mainly consists of a summary of the subject matter of the relevant chapters in the book. This has been supplemented with information from the lectures and ~ 80% of the SPSS instructions that will be required.
SPSS Guideline and Hypotheses Testing for Regressions
Summary International Business Law for IB IBL
Summary midterm Data-Analyse
All for this textbook (21)
Written for
Tilburg University (UVT)
Bedrijfseconomie
Data-Analyse (323624)
All documents for this subject (8)
Seller
Follow
joesvanderstok
Reviews received
Content preview
Chapter 5 – Pairs of Variables
5.1 : Scatter plot, covariance and correlation
Dependent variable (usually Y) = topic of investigation
Independent variable (usually X) = cause of variation
Scatterplot -> used to get a visual idea of the relationship between two (quantitative) variables by
displaying all the (x,y) pairs
Population/Sample cloud = all the dots resulting from the (x,y) pairs
Different possible relationships:
1. Positively linearly related -> best fitting straight line is increasing
2. Negatively linearly related -> best fitting straight line is decreasing
3. Quadratic relationship -> results seem to follow a mountain/valley based parabolic
4. Logarithmic relationship -> results variate wildly for low values but then seem to even out
5. No relationship
Covariance -> measures the degree of linear relationship between y and x
Formula:
N
1
Population covariance: σ X ,Y = ∑ (x −μ )( y −μ y )
N i =1 i x i
n
1
Sample covariance: s X ,Y = ∑ ( x −x )( y i− y )
n−1 i=1 i
-> the reason for ‘n-1’ instead of just ‘n’ in the sample covariance is that it is better at estimating the
population covariance
-> replacing all the y and Y by x and X will result in the formulas for the population variance and the
sample variance
Short cut formula:
N
1
Population covariance: σ X ,Y = ∑ x y −μ μ
N i =1 i i x y
1
Sample covariance: s X ,Y = ¿
n−1
Using the covariance has downsides. A reference point to determine whether the relationship is
strong is missing and the covariance is dependent on the dimensions of the variables
Correlation -> measures the degree of linear relationship between y and x but without the downsides
mentioned above
Formula:
σ X ,Y
Population correlation coefficient: ρ=ρ X , Y =
σ X σY
SX , Y
Sample correlation coefficient: r =r X , Y =
SX SY
-> value of both the coefficients is between (-1,1), where +1 indicates a strong positively linear
,relationship, -1 a strong negatively linear relationship and 0 no relationship (uncorrelated)
5.2 : Regression line
Regression of Y on X = the study of the dependence of Y on X
Least squares (LS) method :
1. Start with a general line with the equation: y = a + bx
2. Fill in the x and find out what values of a and b cause the least overall difference for the y values
Formulas:
S X, Y
Sample regression coefficients: b = 2 and a = y−b x
SX
S X, Y
Population regression coefficients: β 1= 2 and β 0=μ y −β 1 μ x
SX
Sample regression line: ^y =b0 +b1 x (also called: prediction line)
Population regression line: y=β 0 + β 1 x
-> b0/ꟗ0 = the intercept
-> b1/ꟗ1 = the slope
-> sample regression line passes through ( x , y )
-> population regression line passes through ( μ x , μ y )
Interpolation = if a new ‘x’ value is within the range of existing ‘x’ values, predictions can be trusted
Extrapolation = if a new ‘x’ value is outside the range of existing ‘x’ values, predictions can’t be
trusted
Residuals/Errors = the difference between the y-values and the regression line
-> shows the concentration of y-values around the regression line
-> the sum of residuals will always be 0 (otherwise the regression line is not the best fitting line)
Formulas:
Residual/Error: e i= y i− ^yi
n n
Sum of squared errors: SSE=∑ ( y i− ^y i ) =∑ e i
2 2
i=1 i=1
-> the smaller the SSE, the better the predicting performance of the regression line
5.3 : Linear transformations
Transforming a variable ‘X’ can be done using the formula: Y = a + bX
-> this has implications for certain statistics, summarised below:
Population dataset Sample dataset
Location μ y =a+b μ x y=a+b x
μ ymedian =a+b μ xmedian y median =a+ b x median
2 2 2 2 2 2
Variation σ Y =b σ X sY =b s X
σ Y =|b|σ X sY =|b|s X
, Transforming both variables ‘X’ and ‘Y’ can be using two formulas: V = a + bX and W = c + dY
-> this has implications for certain statistics, summarised below:
Population dataset Sample dataset
Covariance σ V ,W =bd σ X ,Y sV , W =bd s X ,Y
Correlation coefficient If bd >0 : ρV , W = ρX ,Y r V ,W =r X , Y
If bd <0 : ρV , W =− ρX , Y r V ,W =−r X , Y
5.4 : Relationship between two qualitative variables
Covariance and correlation coefficient are useless when comparing two qualitative variables
-> instead we use contingency/cross-classification tables, they give the joint frequencies of the data
The benefits of buying summaries with Stuvia:
Guaranteed quality through customer reviews
Stuvia customers have reviewed more than 700,000 summaries. This how you know that you are buying the best documents.
Quick and easy check-out
You can quickly pay through credit card or Stuvia-credit for the summaries. There is no membership needed.
Focus on what matters
Your fellow students write the study notes themselves, which is why the documents are always reliable and up-to-date. This ensures you quickly get to the core!
Frequently asked questions
What do I get when I buy this document?
You get a PDF, available immediately after your purchase. The purchased document is accessible anytime, anywhere and indefinitely through your profile.
Satisfaction guarantee: how does it work?
Our satisfaction guarantee ensures that you always find a study document that suits you well. You fill out a form, and our customer service team takes care of the rest.
Who am I buying these notes from?
Stuvia is a marketplace, so you are not buying this document from us, but from seller joesvanderstok. Stuvia facilitates payment to the seller.
Will I be stuck with a subscription?
No, you only buy these notes for $7.28. You're not tied to anything after your purchase.