Solution manual for marketing research ...tation 7th edition naresh malhotra
Solution manual for Marketing research an applied orientation 7th edition by Malhotra all chapters ISBN;9781292265636
Test Bank For Marketing Research An Applied Orientation 7th Edition Naresh Malhotra
All for this textbook (23)
Written for
Rijksuniversiteit Groningen (RuG)
Marketing Research Methods
EBM080A05
All documents for this subject (1)
Seller
Follow
lamotte01
Reviews received
Content preview
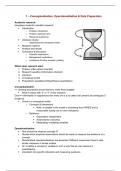
1 – Conceptualization, Operationalization & Data Preparation
Academic research:
Hourglass model for scientific research:
Introduction
o Problem introduction
o Problem statement and
o Research question(s)
Literature review
o (Hypotheses &) conceptual model
Research method
Analysis and results
Conclusion & discussion
o Scientific implications
o Management implications
o Limitations & further research (validity)
Where does research start:
1. Problem (often action oriented)
2. Research question (information oriented)
3. Literature
4. Conceptual model
5. Propositions (qualitative)/Hypotheses (quantitative)
Conceptualization:
=> ‘drawing boundaries around terms to make them tangible’
What is meant with ‘X’ or ‘Y’ in this research
Goal => elimination of vagueness (how many cm is a so called ‘tall’ person) and ambiguity (‘I
bought a)
Come to a conceptual model
o Concepts (& dimension)
Note: a variable in the model is something that VARIES and is
measurable (using one or more indicators)
o Relations:
Dependent/ independent
Antecedents/ outcomes
Moderating/ mediating variables
Operationalization:
How should we measure concept X?
Decide which empirical observations should be made to measure the existence of a
concept
Standardised operationalisations are essential if different researchers have to take
similar measures of similar entities.
Or: to define a concept or variable in such a way that we can measure it
quantitatively.
translation into specific indicators and measuring questions.
,Collecting data:
(population/ sampling/ non-response => generalizability)
Exploratory/descriptive/causal research?
Qualitative/quantitative?
Survey?
Experiment?
Measurement level?
o On what scale did you measure your variable?
o
o
,Data Preparation:
Data analysis often comes in 2 stages:
1. Inspection and preparing data for actual analysis:
o Inspect data (items)
Which variable/measurement scales/coding schemes
Get a feeling for your data, descriptive, graphs
Cleaning your dataset
Oddities, missing/wrong values, outliers.
o Combining variables/items into new dimensions/ factors
2. Actual analysis, testing your hypothesis:
o Regression, cluster
Inspect data:
Missing data
o Listwise deletion → but you’ll be missing a lot of data then.
o Pairwise → So only delete the missing variables if the rest is reliable.
Weird values & outliers
o If impossible value → make it a missing value (or go back to respondent if
possible)
o Otherwise, outlier
What’s the effect on analysis?
Should we use in analysis?
, 2 – Factor Analysis
Marketing concepts are more often too complicated for 1 scales and are measured using
multi-item scales, e.g.:
These are called LATENT variables, or CONCEPTS or CONSTRUCTS
Yet, multi-item scales often have many (and overlapping) items which makes further analysis
complicated.
Multi-item scales: A scale consisting of multiple items, where an item is a single question or
statement to be evaluated.
o
Multicollinearity (if correlation is too high: if variables are highly correlated, it’s hard to
distinguish their individual effects in subsequent analyses)
Complexity
So, data reduction & simplification:
1. Factor analysis → to test or to dig up the constructs.
o To reduce a large(r) set of variables into a smaller set of uncorrelated, on
beforehand unknown, factors or dimensions.
o To test a theoretically assumed known factor structure in a set of items
(“does the factor solution in my data comply with the assumed/ hypothesized
factor structure?”)
2. Reliability analysis → then use this to test.
o To test the reliability of the known/ found underlying dimensions (by
measuring the internal consistency of a known set of items in each
o dimension)
After factor analysis (“Is the factor found ‘strong enough’ to continue
analysis with?”)
After using a set of items validated as a scale by theory (“Is the
theoretical scale also validated or ‘strong enough’ in my research?”)
Factor analysis: what is it about?
Purpose:
o Reduction of a large quantity of data by finding common variance to:
Retrieve underlying dimensions in your dataset, or,
Test if the hypothesized dimensions also exist in your dataset.
Variance → a measure of how data points differ from the mean.
Common variance → amount of variance that is shared among a set of items. If
one goes up it is likely that the other will also go up (unless it’s a reverse scale).
Two central questions:
1. How to reduce a large(r) set of variables into a smaller set of uncorrelated factors?
o Unknown number and structure
o Hypothesized number and structure
Whether the hypothesized dimensionality is visible in my dataset
2. How to interpret these factors (= underlying dimensions), and scores on these
factors?
The benefits of buying summaries with Stuvia:
Guaranteed quality through customer reviews
Stuvia customers have reviewed more than 700,000 summaries. This how you know that you are buying the best documents.
Quick and easy check-out
You can quickly pay through credit card or Stuvia-credit for the summaries. There is no membership needed.
Focus on what matters
Your fellow students write the study notes themselves, which is why the documents are always reliable and up-to-date. This ensures you quickly get to the core!
Frequently asked questions
What do I get when I buy this document?
You get a PDF, available immediately after your purchase. The purchased document is accessible anytime, anywhere and indefinitely through your profile.
Satisfaction guarantee: how does it work?
Our satisfaction guarantee ensures that you always find a study document that suits you well. You fill out a form, and our customer service team takes care of the rest.
Who am I buying these notes from?
Stuvia is a marketplace, so you are not buying this document from us, but from seller lamotte01. Stuvia facilitates payment to the seller.
Will I be stuck with a subscription?
No, you only buy these notes for $10.73. You're not tied to anything after your purchase.