This document contains my notes of the knowledge clip, my notes of the lecture, my notes of my workgroup meeting & summaries of the mandatory (and 2 extra) literature.
2023-2024, Block 1 GW4003MV. Advanced Research Methods
WEEK 2
Are you certain?
Moderation, mediation, and statistical
significance
Inhoud
Knowledge clip..................................................................................................................................................2
Knowledge clip 2: OLS regression.............................................................................................................2
Lecture 2 (8 sept)..............................................................................................................................................4
Part 1. OLS and moderation..........................................................................................................................4
Part 2. Mediation..........................................................................................................................................8
Part 3. Statistical significance......................................................................................................................12
Part 4. Beyond p < 0.05...............................................................................................................................14
Workgroup meeting (12 sept).........................................................................................................................17
Homework assignment...............................................................................................................................17
Research case 1: Corrector therapy for infants with Malycosis...............................................................17
Research case 2: Interpreting study results using OLS regression...........................................................22
Literature........................................................................................................................................................29
Wheelan: Chapter 9: Inference...............................................................................................................30
Wheelan: Chapter 11: Regression Analysis.............................................................................................32
Wheelan: Chapter 12: Common Regression Mistakes............................................................................32
Kennedy-Shaffer (2019). Before p < 0.05 to Beyond p < 0.05: Using history to contextualize p-values and
significance testing..................................................................................................................................32
Greenland, et al. (2016). Statistical tests, P-values, confidence intervals, and power: a guide to
misinterpretations..................................................................................................................................32
Wasserstein (2019). Moving to a world beyond “p < 0.05.”....................................................................32
EXTRA LITERATURE: Nuzzo (2014). Scientific Method: Statistical errors.................................................33
EXTRA LITERATURE: Cole, Hernan (2002). Fallibility in estimating direct effects.....................................33
1
,2023-2024, Block 1 GW4003MV. Advanced Research Methods
There are many types of regressions. The 2 types most commonly used are: OLS/linear and logistic
regression. Which regression type you should use, depends on the outcome variable (Y) of interest:
OLS regression Y = continuous.
Logistic regression Y = dichotomous.
Continuous variables can take any value within a
certain range. E.g. age, BMI.
Dichotomous variables only have 2 potential
(often binary) outcomes. E.g. insured/uninsured,
admitted to hospital (yes/no).
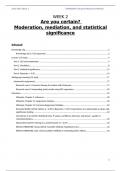
Example: RQ: What is the effect of height on weight?
The regression equation describes the relationship
between the exposure variable (X) and the outcome
variable (Y).
The beta coefficients are estimated averages and are
always expressed on the same scale as the outcome (Y).
Running an OLS regression means that we are fitting a
linear curve that is as close to the observation points as
possible.
The name ‘Ordinary Least Squares’ is attributed to the foundation of principle of minimizing the sum of the
squared differences between the fitted/predicted and the observed values. We calculate the squared
2
,2023-2024, Block 1 GW4003MV. Advanced Research Methods
differences because some differences are positive and some are negative, and by calculating the squared
difference you cancel that out.
The intercept/constant (B0) describes
the value of Y at X=0 (in theory ofcourse,
because in practice this is almost
impossible).
Coefficient (B1) describes the slope; this
represent the average increase in weight
with every increase in height.
The difference between the estimated
value by calculating (via the regression
equation) and the observed value is called
the ‘error term’ (ε). The smaller the error
term, the better the estimate.
Coefficients of an OLS regression have
multiple meanings: not only positive and
negative, but also the average size of the
effect.
Usually there are more variables. Look at this example:
3
, 2023-2024, Block 1 GW4003MV. Advanced Research Methods
Lecture 2 (8 sept)
Part 1. OLS and moderation
Slide 3 – 6. Recap week 1
We use DAGs to meet the conditions
(positivity, consistency and exchangeability),
especially for the exchangeability condition
via adjustment in the regression analysis.
Slide 8 + 9
The type of regression analysis you
use is dependent on the outcome
variable. If you have a continuous
variable as outcome, you will use an
OLS regression analysis.
Adjustment in regression analysis
always means: include one or more
confounders (and/or intermediate
variables on causal paths) in
regression analysis at the same time.
So adjustment = including.
There are many terms used for this:
adjustment, controlling, correcting,
accounting, factoring in, …
Slide 10
However, the software doesn’t tell
you how to interpret the results.
DAGs help you with the
interpretation.
4
The benefits of buying summaries with Stuvia:
Guaranteed quality through customer reviews
Stuvia customers have reviewed more than 700,000 summaries. This how you know that you are buying the best documents.
Quick and easy check-out
You can quickly pay through credit card or Stuvia-credit for the summaries. There is no membership needed.
Focus on what matters
Your fellow students write the study notes themselves, which is why the documents are always reliable and up-to-date. This ensures you quickly get to the core!
Frequently asked questions
What do I get when I buy this document?
You get a PDF, available immediately after your purchase. The purchased document is accessible anytime, anywhere and indefinitely through your profile.
Satisfaction guarantee: how does it work?
Our satisfaction guarantee ensures that you always find a study document that suits you well. You fill out a form, and our customer service team takes care of the rest.
Who am I buying these notes from?
Stuvia is a marketplace, so you are not buying this document from us, but from seller dsmeets123. Stuvia facilitates payment to the seller.
Will I be stuck with a subscription?
No, you only buy these notes for $6.43. You're not tied to anything after your purchase.