Every step you need for SPSS Casual Anal. Techn. for internaltional students (Stapsgewijze SPSS samenvatting (behaald met pass)
All for this textbook (5)
Written for
Tilburg University (UVT)
Human Resource Studies
Measurement, Methods and Statistics (424023-B-6)
All documents for this subject (3)
Seller
Follow
wendyvandosselaar
Content preview
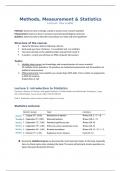
Methods, Measurement & Statistics
Lecturer: Paul Lodder
Methods: teach you how to design a study to answer your research question
Measurement: teach you how to measure social and psychological constructs
Statistics: teach you how to describe and analyze your data and test hypotheses
Structure of the course:
Study the literature before following a lecture
Each week you have 2 lectures: 1 on methods and 1 on statistics
You have tutorials on the statistical topics (except from week 1)
In week 2, 4 and 6 you will have an SPSS computer lab sessions
Tests:
1. Multiple choice exam: test knowledge and comprehensions of course material
50 multiple choice questions: 25 questions on methods/measurement and 25 questions on
statistics/measurement
2. SPSS practical test: tests whether you master basic SPSS skills. Test is similar to assignments
in SPSS lab sessions
Graded Pass or Fail
Lecture 1: introduction to Statistics
Literature: Rebecca M. Warner, and Applied Statistics II (Multivariable and Multivariate Techniques)., Sage,
2021 (Third Edition, Course Pack). ISBN: 9781529780970
Field A. Exploratory factor analysis (book chapter on Canvas)
Statistics lectures:
During the statistics lectures we discussed the most important topics in the book. Especially
focus on those topics when studying the book. The exam will primarily involve questions on
topics discussed during the lectures.
,Statistics tutorials:
During the statistics tutorials the aim is to practice with the topics discussed during the
lecture. Complete exercises (see Canvas) before attending the tutorial. Tutorials are a perfect
practice for the exam.
Purpose of statistics:
Describe/summarize data: descriptive statics
Reduce the data to understandable pieces of information.
Example: What proportion of Dutch adults has a driver’s license?
Example: what is the average delay across all train travels in the Netherlands today?
Drawing inferences about populations: inferential statistics
In science we often want to draw conclusions about populations
Example: Are COVID-19 vaccines safe and effective in the general population?
Problem: We can often only make observations on a selection of cases from a population
Solution: We can use inferential statistics to evaluate whether the results in the sample are
generalizable to the population
Studying complex multivariate relationships: statistical modeling
In research we are often interested in relationships between several variables
Example: To what extent does years of education predict healthy lifestyle, controlled for
income differences?
Statistical modeling can help to uncover such complex relations
Lecture overview:
Measurement levels
- Important characteristic of variables in your data
Data inspection
- Graphs
- Statistics
,Part 1: measurements levels
In the social sciences we often collect quantitative data using questionnaires. For example
measurement of participant age, socio-economic status, attitudes, etc.
We make a basic distinction between four “types” of data, known as measurement levels:
Nominal
Ordinal
Interval
Ratio
They differ in how refined or exact the measurement is. Nominal is the lowest and ratio is the highest
level. Measuring at a lower level is often easier but less informative.
1. Nominal data: numbers express different unordered categories or groups.
Example: marital status:
1 = single
2 = married
3 = in a serious relationship, but not married
4 = not specified otherwise
Nominal variables classifies cases into two or more categories. Categories must be exhaustive
(all possibilities should be covered) and mutually exclusive (i.e., every case fits into one
category and one category and one category only).
2. Ordinal data: numbers express an ordering (less/more)
Example: smoking intensity
1 = never
2 = at least 1 cigarette per month
3 = at least 1 cigarette per week
4 = more than 5 cigarettes per day
Numbers express more or less of a quantity, but the difference between 1 and 2 is not the
same in quantity than between 2 and 3, 3 and 4, and so on.
There should be a logical order. Not logical: Never Occasionally Daily Often
Make it so concrete as possible!
3. Interval: numbers express differences in quantity using a common unit
Example: IQ test score
The difference between 70 and 80 points is comparable to a difference between 100 and
110. Both span a difference of 10 units.
Example: Temperature
If on Monday the temperature is 30 degrees, on Tuesday 25 degrees, and Wednesday, 15
degrees, then we can say that the temperature drop between Tuesday and Wednesday is
twice as large as the drop between Monday and Tuesday.
Zero point is arbitrary: zero Fahrenheit ≠ zero Celsius
, 4. Ratio: numbers have a natural zero point
Example: Length, weight or income
A length, weight, or income of 0 can be meaningfully interpreted
This allows for relative comparisons: if Peter’s monthly income is 5000 euros and John’s is 50
euros, then Peter’s income is 100 times higher than John’s income
This comparison is not possible on interval level: 6 degrees is not twice as hot as 3 degrees
Good to know: You can go from ratio measurement level to for example ordinal measurement, but
not the other way around.
Both interval and ratio-level data are referred to as scale data. The idea is simple: all variables that
are not nominal or ordinal are treated as scale-level variables. SPSS distinguishes between nominal,
ordinal and scale
Measurement level is a property of the measurement values, it is not an intrinsic property of the
thing you are measuring.
Example: you cannot say that “intelligence” has interval level;
Intelligence can be measured at different levels depending on the measurement instrument
- Ordinal: variable indicating the highest completed education (primary, secondary, etc.)
- Interval: score resulting from an IQ-test
- Ratio: skull circumference in centimeters
Measurement level and statistical analysis
Measurement levels determine the kind of statistics and statistical analyses you can use
meaningfully.
Example: the mean of a nominal variable is meaningless (e.g., “the average eye color).
Hence, for the analyses you should always respect the measurement levels of the variables you will
use in statistical analyses.
Many of the commonly used statistical techniques assume scale data.
Problem: in the social sciences, it is not evident that variables have an interval level
Example: attitude towards a governmental policy on a scale of 0 to 10
Therefore, it is common practice to simply assume that we have acquired interval data, without
worrying too much if this is really true and this turns out to be very useful.
The benefits of buying summaries with Stuvia:
Guaranteed quality through customer reviews
Stuvia customers have reviewed more than 700,000 summaries. This how you know that you are buying the best documents.
Quick and easy check-out
You can quickly pay through credit card or Stuvia-credit for the summaries. There is no membership needed.
Focus on what matters
Your fellow students write the study notes themselves, which is why the documents are always reliable and up-to-date. This ensures you quickly get to the core!
Frequently asked questions
What do I get when I buy this document?
You get a PDF, available immediately after your purchase. The purchased document is accessible anytime, anywhere and indefinitely through your profile.
Satisfaction guarantee: how does it work?
Our satisfaction guarantee ensures that you always find a study document that suits you well. You fill out a form, and our customer service team takes care of the rest.
Who am I buying these notes from?
Stuvia is a marketplace, so you are not buying this document from us, but from seller wendyvandosselaar. Stuvia facilitates payment to the seller.
Will I be stuck with a subscription?
No, you only buy these notes for $6.62. You're not tied to anything after your purchase.