This document includes my personal classnotes on all lectures during 2023. It is based on the professor's presentation and my own notes/clarifications. With this summary I've got a 17/20. It's the best preparation for the exam!
International Economics
EVALUATION:
Final Exam (70%): June
Mid-term exam in class (20%): March 31
Active Participation in Tutorial (10%): every week
Lecture 1
Globalization – stylized facts
= Economic activity on a global scale
= Interconnection between a lot of places
= Multiculturalism on a micro-level (p.e. languages in New York)
Not only between countries, but also reflects in countries our cities
Process accelerated in the recent years (10x increase since 1980 compared to 2011)
What about recent trends?
Drop in 2020 due to Covid-19 because of restriction on mobility between and within
countries.
War between Russia and Ukraine: yellow line (Russia and Ukraine) drops for both
export and import because of the war and restriction on trade with Russia from big
world players.
Green line (Middle East countries) benefitted from the war (increase) because they
had to fill in for the oil demand that was no longer covered by Russia.
Lecture 2
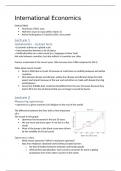
Measuring opnenness
= openness to a given economy (vb: Belgium to the rest of the world)
The difference between the lines tells us how important
oil is
The trends in this graph:
Openness has increased in the last 50 years.
We are more and more open we live in a flat
world
Most of the jumps in the black curve were driven
by the volatility of oil (red curve)
Openness index
- What means openness? What is maximum openness?
- Idea from Helpman: Idealized world without (trade) barriers
o No discrimination between domestic and foreign goods
o With perfect specialization: each country consumes its share in global
production from every other country in the world.
, BE: represent about 0,5% of World GDP, so should consume 0,5% of
cars produced in the world, 0,5% of chocolate produced in the world,
0,5% of beers produced in the world, …
Globalization potential
Denote exporter by i, importer by j and the world by w
- Xij: exports from country I to country j
- Xi: production in country I defined as Xi = ∑ X ij
j
- Xw: world production defined as XW = ∑ X j
j
Bilateral imports can be rewritten as
World imports as
The share of imports in world production can then be expressed as
Where H is the Herfindahl index for the concentration of consumption
Same graph as before but now with the Benchmark = 1 – H
displayed
The gap between the actual openness and what we should
expect if we were in a very open world. The gap is still very big.
The world is not as flat as we think
This graph gives us more perspective
Alternative measure: Flat world
Trade between countries without impact of bilateral frictions
What would international trade look like in such a world?
Cumulative density function of trade flows and how they are
distributed over distances. If you concentrate on 5000 km, there
is about 54 percent of trade that is done within 5000 km or less.
A lot of trade (majority) is being done relatively close (more than
50% is done within 5000 km around Belgium).
Most trade between countries that are close geographically.
,In an ideal world: less trade close by, more trade over a longer
distance
In an ideal world: only 20% of the trade done within 5000 km
Comparison over time.
The world did not flatten.
In between black and red you can actually see that it increased: we
even trade even closer than in the 1950s
The idealized world is far from reality but is still a good benchmark to
have to think about this flat world.
In 1950s we were closer to the ideal scenario.
Why do we prefer to trade super close? Let’s think about it …
The force of gravity
Data exploration
Let’s have a closer look at aggregate trade flows
- Total exports: no products (no export of shoes, beer, … but overall trade from BE to
NED)
- Country to country: no firms (we don’t think about apple, amazon, but we think
about a country in total)
- Focus on one year: 2015
Trade and economic size
There is a positive relationship between a country’s GDP and how much
they import from New Zealand. Bigger EU partners import more from
NZ (Germany, France, G-B). Malta and Slovenia (smaller countries)
import less.
Positive correlation between a country’s GDP (economic size of a
country) and its export to NZ
Distance is some kind of impediment of trade
There is a role for economic size and distance
That should explain why we don’t trade with countries that are so far
away.
,BUT other impediments of trade …
- Common language: helps communication and relationship. Reduces the barrier that
there is to trade and gather information + tells us about historical ties between
countries (sign of a stronger cultural link between countries)
- Common history: stronger ties
- Euro as currency (exchange rates risks): value of the good might
be affected by the exchange rate. Same currency, less risks.
- EU member: legislation, open borders, …
- Colonization
“Naïve” gravity model
Country I’s export to country J
Y: the production in the exporting countries positively depends on this factor
E: the purchasing power of the importing country positively depends on this factor
D: distance
Keeping constant the country’s size, distance is very important. The further away the
countries, the lower the bilateral trade flows
Gekke teken ij captures all the other impediments to trade + distance
This was first applied by Tinbergen (1962)
General gravity
Generalization of the “naïve” version
Si : relates to the characteristics of the exporter
Mj: relates to the characteristics of the importer
Imbed also other important characteristics such as the economic size (in the S),
technological aspects of a country, price levels, institutions that may facilitate trade,
preferences, …
Structural gravity model
Estimation
Structural gravity model can be estimated as a linear model:
Just take the log from the general model (log(ab) = a + b)
Simple definition of bolleke/streepje ij: adding distance
Which relationship should we expect between distance and export? Negative
relationship (alpha should be negative)
, Adding language (adding a dummy for countries that share the same language)
Value of alpha language: positive (it seems that sharing a language facilitates trade)
Adding former colony (adding a dummy if you at some point were colonized by France)
Value of alpha former colony: positive (share these institutions from long time ago,
which should boost the trade)
Adding euro
Value of alpha euro: positive (no exchange rate risks, no transaction costs, …)
Adding EU (dummy for countries that belong to the EU)
Value of alpha EU: positive
Coefficient for distance is quite big an increase in distance
by 1 km is likely to decrease trade by 1%.
Language and part of the EU also bigger roles.
Still even within the EU some important other impediments
to trade.
Currency and former colony same impact
Other frictions: Taste
How much these French households spend on butter and
olive oil.
Normandy and Brittany consume a very large amount of
butter and the south of France seem to use more olive oil for
cooking instead of butter.
Cows are typically owned in the north of France
Olive trees are typically seen in the south of France
Production of butter in the North, production of olive
oil in the South
Taste between and even within countries
France colonized Canada for a long time. We still see that in
Quebec there is still a big preference for French goods.
Compare the share of these products in Quebec and Ontario.
Transport costs and history (colony) can shape preference
Other frictions: Politics
Benchmark of the naïve gravity prediction
Pakistan to GB exports: stable over time (after the independence
of Pakistan, stable relationship)
On the other hand, if you look to Pakistan’s export to India:
political tension and conflict had a very big impact on trade,
beyond distance!
The benefits of buying summaries with Stuvia:
Guaranteed quality through customer reviews
Stuvia customers have reviewed more than 700,000 summaries. This how you know that you are buying the best documents.
Quick and easy check-out
You can quickly pay through credit card or Stuvia-credit for the summaries. There is no membership needed.
Focus on what matters
Your fellow students write the study notes themselves, which is why the documents are always reliable and up-to-date. This ensures you quickly get to the core!
Frequently asked questions
What do I get when I buy this document?
You get a PDF, available immediately after your purchase. The purchased document is accessible anytime, anywhere and indefinitely through your profile.
Satisfaction guarantee: how does it work?
Our satisfaction guarantee ensures that you always find a study document that suits you well. You fill out a form, and our customer service team takes care of the rest.
Who am I buying these notes from?
Stuvia is a marketplace, so you are not buying this document from us, but from seller hannepattyn. Stuvia facilitates payment to the seller.
Will I be stuck with a subscription?
No, you only buy these notes for $8.62. You're not tied to anything after your purchase.