,Chapter 1: What is Statistics?
1.1 a. Population: all generation X age US citizens (specifically, assign a ‘1’ to those who
want to start their own business and a ‘0’ to those who do not, so that the population is
the set of 1’s and 0’s). Objective: to estimate the proportion of generation X age US
citizens who want to start their own business.
b. Population: all healthy adults in the US. Objective: to estimate the true mean body
temperature
c. Population: single family dwelling units in the city. Objective: to estimate the true
mean water consumption
d. Population: all tires manufactured by the company for the specific year. Objective: to
estimate the proportion of tires with unsafe tread.
e. Population: all adult residents of the particular state. Objective: to estimate the
proportion who favor a unicameral legislature.
f. Population: times until recurrence for all people who have had a particular disease.
Objective: to estimate the true average time until recurrence.
g. Population: lifetime measurements for all resistors of this type. Objective: to estimate
the true mean lifetime (in hours).
Histogram of wind
0.30
0.25
0.20
Density
0.15
0.10
0.05
0.00
5 10 15 20 25 30 35
wind
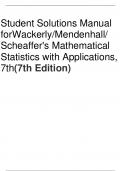
1.2 a. This histogram is above.
b. Yes, it is quite windy there.
c. 11/45, or approx. 24.4%
d. it is not especially windy in the overall sample.
1
,2 Chapter 1: What is Statistics?
Instructor’s Solutions Manual
Histogram of U235
0.25
0.20
0.15
Density
0.10
0.05
0.00
0 2 4 6 8 10 12
U235
1.3 The histogram is above.
Histogram of stocks
0.30
0.25
0.20
Density
0.15
0.10
0.05
0.00
2 4 6 8 10 12
stocks
1.4 a. The histogram is above.
b. 18/40 = 45%
c. 29/40 = 72.5%
1.5 a. The categories with the largest grouping of students are 2.45 to 2.65 and 2.65 to 2.85.
(both have 7 students).
b. 7/30
c. 7/30 + 3/30 + 3/30 + 3/30 = 16/30
1.6 a. The modal category is 2 (quarts of milk). About 36% (9 people) of the 25 are in this
category.
b. .2 + .12 + .04 = .36
c. Note that 8% purchased 0 while 4% purchased 5. Thus, 1 – .08 – .04 = .88 purchased
between 1 and 4 quarts.
, Chapter 1: What is Statistics? 3
Instructor’s Solutions Manual
1.7 a. There is a possibility of bimodality in the distribution.
b. There is a dip in heights at 68 inches.
c. If all of the students are roughly the same age, the bimodality could be a result of the
men/women distributions.
Histogram of AlO
0.20
0.15
Density
0.10
0.05
0.00
10 12 14 16 18 20
AlO
1.8 a. The histogram is above.
b. The data appears to be bimodal. Llanederyn and Caldicot have lower sample values
than the other two.
1.9 a. Note that 9.7 = 12 – 2.3 and 14.3 = 12 + 2.3. So, (9.7, 14.3) should contain
approximately 68% of the values.
b. Note that 7.4 = 12 – 2(2.3) and 16.6 = 12 + 2(2.3). So, (7.4, 16.6) should contain
approximately 95% of the values.
c. From parts (a) and (b) above, 95% - 68% = 27% lie in both (14.3. 16.6) and (7.4, 9.7).
By symmetry, 13.5% should lie in (14.3, 16.6) so that 68% + 13.5% = 81.5% are in (9.7,
16.6)
d. Since 5.1 and 18.9 represent three standard deviations away from the mean, the
proportion outside of these limits is approximately 0.
1.10 a. 14 – 17 = -3.
b. Since 68% lie within one standard deviation of the mean, 32% should lie outside. By
symmetry, 16% should lie below one standard deviation from the mean.
c. If normally distributed, approximately 16% of people would spend less than –3 hours
on the internet. Since this doesn’t make sense, the population is not normal.
n
1.11 a. c = c + c + … + c = nc.
i=1
n n
b. cyi = c(y1 + … + yn) = c yi
i=1 i=1
n
c. (x
i=1
i + yi ) = x1 + y1 + x2 + y2 + … + xn + yn = (x1 + x2 + … + xn) + (y1 + y2 + … + yn)
The benefits of buying summaries with Stuvia:
Guaranteed quality through customer reviews
Stuvia customers have reviewed more than 700,000 summaries. This how you know that you are buying the best documents.
Quick and easy check-out
You can quickly pay through credit card or Stuvia-credit for the summaries. There is no membership needed.
Focus on what matters
Your fellow students write the study notes themselves, which is why the documents are always reliable and up-to-date. This ensures you quickly get to the core!
Frequently asked questions
What do I get when I buy this document?
You get a PDF, available immediately after your purchase. The purchased document is accessible anytime, anywhere and indefinitely through your profile.
Satisfaction guarantee: how does it work?
Our satisfaction guarantee ensures that you always find a study document that suits you well. You fill out a form, and our customer service team takes care of the rest.
Who am I buying these notes from?
Stuvia is a marketplace, so you are not buying this document from us, but from seller QuizMerchant. Stuvia facilitates payment to the seller.
Will I be stuck with a subscription?
No, you only buy these notes for $27.99. You're not tied to anything after your purchase.