Summary Part C Statistics 1 (Applying Statistics in Behavioural Research)
118 views 0 purchase
Course
Statistiek 1 (SOWPSB1RS10N)
Institution
Radboud Universiteit Nijmegen (RU)
Book
Applying statistics in behavioural research
This document contains the summary of part C of the statistics 1 course of B1 psychology at Radboud University. It was written in 2023 and based on the book Applying Statistics in Behavioural Research by Jules L. Ellis.
Summary Part B Statistics 1 (Applying Statistics in Behavioural Research)
Summary Part A Statistics 1 (Applying Statistics in Behavioural Research)
Summary Statistics 2 Part B
All for this textbook (4)
Written for
Radboud Universiteit Nijmegen (RU)
Psychologie
Statistiek 1 (SOWPSB1RS10N)
All documents for this subject (9)
Seller
Follow
isawilms
Reviews received
Content preview
1
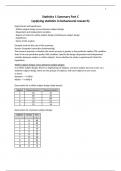
Statistics 1 Summary Part C
(applying statistics in behavioural research)
Experiments and hypotheses:
- Within-subject design versus between-subject design
- Dependent and independent variables
- Degree of control in within-subject design and between-subject design
- Hypotheses
- Name of the analysis
Example used for this part of the summary:
Human-Computer Interaction (mindreading)
The research question is whether the mean accuracy is greater in the predictive speller (PS) condition
than in the non-predictive speller (NS) condition. Specify the design (dependent and independent
variable; between-subject or within-subject). Asses whether the study is experimental. State the
hypothesis.
Within-subject designs versus between-subject designs
In a within-subject design, there is a single group of subjects, and each subject has two scores. In a
between-subject design, there are two groups of subjects, and each subject has one score.
In short:
Between --> A OR B
Within --> A AND B
Data matrix for a within-subject design (wide layout):
Subject Measurement A Measurement B
1 66 25
2 82 36
3 73 84
4 19 52
5 22 16
Data matrix for a between-subject design:
Subject Group Scor
e
1 A 66
2 A 82
3 A 73
4 A 19
5 A 22
6 B 25
7 B 36
8 B 84
9 B 52
10 B 16
, 2
Dependent and independent variables
The dependent variable is presumed to be the consequence or outcome. The independent variable is
presumed to be the cause or input. In this book quantitative dependent variables and qualitative
independent variables will be used.
A qualitative independent variable is called a factor.
The distinction within-subject designs versus between-subject design is essentially a property of the
independent variable, and we shall henceforth distinguish withing-subject factors and between-
subject factors.
When you describe a design, you should state per factor whether it is within-subject or between-
subject.
Degree of control in within-subject and between-subject designs
If the study has more than one independent variable, then the degree of control should be evaluated
for each independent variable separately. In this book, the term experiment will be used for studies
with the following properties:
1. The study should actively manipulate the independent variable. This means that the
researcher can vary the level of the independent variable at will.
2. In order to make a between-subject factor experimental, the manipulation should take the
form of randomisation. This means that the subjects are randomly assigned to one or the
other condition (level of the independent variable).
3. In order to make a within-subject factor experimental, the manipulation should take the
form of counterbalancing. This means that the conditions are presented in a random order,
and each subject can have a different order.
In experiments, the researcher actively manipulates reality by changing the levels of the independent
variable at will. These levels are often called conditions; if X causes Y, and if I change X, then – all
other things being equal – Y should change too. This can be viewed as a definition of causality.
Actions of the researcher that serve to ensure causal inference are called ‘control measures’.
For example, randomisation or counterbalancing.
Assignments and orders are random only if the assignment or order is determined by throwing a dice
or using a random generator. Doing it yourself without any awareness of a system is incorrect and
not random.
Counterbalancing
Conditions are presented in a random order, and each subject can have a different order.
Usually, the number of subjects with AB and BA are forced to be equal. Counterbalancing in
necessary to make a factor experimental, but this is not always possible. For example, if the within-
subject factor is Time with levels Before treatment and After treatment, then changing the order of
conditions is of course not possible.
Randomisation
, 3
The subjects are randomly assigned to one or the other condition. The consequence of this is that
both groups are on average about the same at the start of the experiments.
Example of stating the degree of control:
The independent variable Speller is experimental. Explanation: it is counterbalanced.
When it is not an experiment is it a passive observation:
Passive observation = when the researcher does not influence the independent variable.
Primary explanation = the explanation that a correlation or mean difference is reflecting a causal
effect of the independent variable on the dependent variable.
In passive observation studies, it is often difficult to establish that the primary explanation is correct:
Confounding = when there are many other variables that intermingle and are associated with both
the independent and the dependent variable, which makes it difficult to disentangle their effects.
It is often difficult to determine which variable is the cause and which variable is the consequence.
Either variable may be both cause and consequence in a feedback loop. In general, passive
observations lead to the presence of alternative explanations for observed correlations or mean
differences. This book encourages you to always state an alternative explanation in the analysis of an
observation study.
Hypotheses
Whether the independent variable has an effect on the dependent variable can be stated in two
possible answers: yes and no. Therefore, there are two hypotheses;
Null hypothesis, when the answer is no (the opposite of the research hypothesis),
- should always contain equality of the means as one of the possibilities (so no ≠, <, or >)
- you will believe this hypothesis if the evidence is inconclusive or insufficient or when you don’t
know
H 0 : µA = µB
Alternative hypothesis, when the answer is yes
- you will believe this hypothesis when there is ample evidence for it
H A : µA ≠ µB
Always replace A and B with the names of the actual conditions:
H0 : µbefore = µafter
These are ‘two sided’ hypotheses. The use of the Greek letter µ indicates that it is a mean of the
population and not the sample. At this stage we do not need to know the population means.
If the research question is directional - whether condition A, in comparison to condition B, has a
positive effect on the mean of the dependent variable – the hypotheses look like this:
H 0 : µA ≤ µB
H A : µA > µB
These are ‘one sided’ hypotheses. Only use this when you’re not interested in an unexpected
negative effect. An advantage of one-sided tests is that smaller samples can be sufficient to obtain
significance. This is great when it’s difficult to obtain large samples for a study.
The benefits of buying summaries with Stuvia:
Guaranteed quality through customer reviews
Stuvia customers have reviewed more than 700,000 summaries. This how you know that you are buying the best documents.
Quick and easy check-out
You can quickly pay through credit card or Stuvia-credit for the summaries. There is no membership needed.
Focus on what matters
Your fellow students write the study notes themselves, which is why the documents are always reliable and up-to-date. This ensures you quickly get to the core!
Frequently asked questions
What do I get when I buy this document?
You get a PDF, available immediately after your purchase. The purchased document is accessible anytime, anywhere and indefinitely through your profile.
Satisfaction guarantee: how does it work?
Our satisfaction guarantee ensures that you always find a study document that suits you well. You fill out a form, and our customer service team takes care of the rest.
Who am I buying these notes from?
Stuvia is a marketplace, so you are not buying this document from us, but from seller isawilms. Stuvia facilitates payment to the seller.
Will I be stuck with a subscription?
No, you only buy these notes for $3.36. You're not tied to anything after your purchase.