This document contains the summary of part A of the statistics 1 course of B1 psychology. It was written in 2023 and based on the book Applying Statistics in Behavioural Research by Jules L. Ellis.
Summary Part C Statistics 1 (Applying Statistics in Behavioural Research)
Summary Part B Statistics 1 (Applying Statistics in Behavioural Research)
Summary Statistics 2 Part B
All for this textbook (4)
Written for
Radboud Universiteit Nijmegen (RU)
Bachelor Psychologie
Statistics 1 (SOWPSB1RS10E)
All documents for this subject (1)
2
reviews
By: renatop2803 • 1 year ago
By: sarahsmith2 • 1 year ago
Very clear and complete. Definitely helped me understand everything better. Would recommend!
Seller
Follow
isawilms
Reviews received
Content preview
Statistics 1 Summary Part A
(applying statistics in behavioural research)
Basic report of one variable contains:
- Design, degree of control, and name of the analysis
- Frequency distribution, N, and histogram
- Five-number summary, outliers, modified boxplot
- Mean and standard deviation
- Indication of normality
Design = name of variable, measurement level of the variable, and ALL possible outcomes of the
variable
Example:
mood, qualitative, happy/sad/angry
cookies eaten, quantitative, 1-10
Qualitative variable = categories or levels that are not ordered (nominal or ordinal)
example: colour, mood
Quantitative variable = numerical outcomes (interval or ratio)
Binary variable = variable with two levels (happy/sad, 1/2)
Discrete variable = only integer numbers as outcomes (1, 2, 3, 4, 5 which can only contain these
numbers)
Continuous variable = interval of real numbers (1-5 which can contain numbers like 1.22 or 3.56)
Nominal = categories
Ordinal = categories with an order (gold/silver/bronze)
Degree of control = whether the variable was passively observed or actively manipulated
Manipulated = when the investigator had created or changed that aspect of reality
Observed = when it describes a part of the reality that is not changed by the investigator
Example:
when you investigate the effects of drinking coffee on the exam score of students, and you give some
students coffee and other water, then drink (coffee/water) is manipulated, and the exam score is
observed
Name of the analysis
In this case the analysis is called a univariate exploratory data analysis (EDA).
Frequency distribution = table that contains the frequencies or counts of possible scores or intervals
of possible scores.
There are six rules when you’re using a frequency distribution:
1. Use intervals ONLY for quantitative, continuous variables (do NOT use intervals for qualitative
variables and discrete variables, but count each possible score)
2. Intervals should all have the same width (1-9, 10-19, 20-29, etc.)
, 3. When choosing intervals, there should be at least seven that are not empty (zero), if possible
4. When choosing intervals, there should be at least one interval that has a frequency higher
than five, if possible
5. Also list intervals if they are surrounded by non-empty intervals.
6. Try to let intervals start and end with easy numbers. So, 1-5 instead of 1.34-4.21
Example:
Age Frequency
20-29 2
30-39 4
40-49 4
50-59 5
60-69 3
70-79 1
80-89 0
90-99 1
N = number of observations/participants
Histogram = chart of the frequency distribution
One axis should have the name of the variable and the other axis frequency/count. Frequency
distribution always includes scores and frequency.
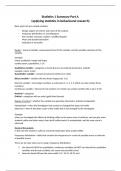
For qualitative variables without an order or ranking, a histogram would falsely suggest that there is
some order in for example, a favourite type of sport. A pie chart like this might be a better option in
this case:
The benefits of buying summaries with Stuvia:
Guaranteed quality through customer reviews
Stuvia customers have reviewed more than 700,000 summaries. This how you know that you are buying the best documents.
Quick and easy check-out
You can quickly pay through credit card or Stuvia-credit for the summaries. There is no membership needed.
Focus on what matters
Your fellow students write the study notes themselves, which is why the documents are always reliable and up-to-date. This ensures you quickly get to the core!
Frequently asked questions
What do I get when I buy this document?
You get a PDF, available immediately after your purchase. The purchased document is accessible anytime, anywhere and indefinitely through your profile.
Satisfaction guarantee: how does it work?
Our satisfaction guarantee ensures that you always find a study document that suits you well. You fill out a form, and our customer service team takes care of the rest.
Who am I buying these notes from?
Stuvia is a marketplace, so you are not buying this document from us, but from seller isawilms. Stuvia facilitates payment to the seller.
Will I be stuck with a subscription?
No, you only buy these notes for $3.36. You're not tied to anything after your purchase.